. 2025 Oct 6;15(10):2036-2053.
doi: 10.1158/2159-8290.CD-24-1856.

Divergent Evolution of Malignant Subclones Maintains a Balance between Induced Aggressiveness and Intrinsic Drug Resistance in T-cell Cancer

Affiliations

Divergent Evolution of Malignant Subclones Maintains a Balance between Induced Aggressiveness and Intrinsic Drug Resistance in T-cell Cancer

Terkild B Buus et al. Cancer Discov. .

Abstract

Evolution and outgrowth of drug-resistant cancer cells are common causes of treatment failure. Patients with leukemic cutaneous T-cell lymphoma have a poor prognosis because of the development of drug resistance and severe bacterial infections. In this study, we show that most patients with leukemic cutaneous T-cell lymphoma harbor multiple genetically distinct subclones that express an identical clonal antigen receptor but display distinct phenotypes and functional properties. These coexisting malignant subclones exhibit differences in tissue homing, metabolism, and cytokine expression and respond differently to extrinsic factors like Staphylococcus aureus and cancer drugs. Indeed, although S. aureus toxins selectively enhance activation and proliferation of certain subclones, these responsive subclones are also the most intrinsically sensitive to cancer drugs when the stimuli are removed. Consequently, although the divergent evolution of malignant subclones drives aggressiveness, adaptability, and drug resistance by removing extrinsic stimuli and mapping malignant subclones, we can expose inherent vulnerabilities that can be exploited in the treatment of these cancers.

Significance: Cancer cells have inherent disparity in hallmark traits, such as aggressiveness and intrinsic drug resistance. We show that segregation of hallmark traits on different coexisting subclones is common and augments adaptability, aggressiveness, and drug resistance of the overall cancer population. Importantly, this segregation exposes vulnerabilities that can be exploited in individualized therapies.


Conflict of interest statement

T.B. Buus reports grants from LEO Foundation and Danish Cancer Society during the conduct of the study; personal fees from Novo Nordisk A/S outside the submitted work; and a patent for Treatment of Lymphoma (WO2025/093666) issued. C.K. Vadivel reports grants from Danish Cancer Society (Kræftens Bekæmpelse, R350-A20095 and R389-A23017) and Knæk Cancer (Fight Cancer) during the conduct of the study, as well as a patent for Treatment of Lymphoma (WO2025/093666) issued. L. Yan reports grants from Danish Cancer Society outside the submitted work. M.H. Andersen reports grants, personal fees, and nonfinancial support from IO Biotech and personal fees from Astellas Pharma outside the submitted work. M. Wobser reports personal fees from Takeda, Kyowa Kirin, and Recordati Rare Diseases outside the submitted work. J.C. Becker reports personal fees and other support from ICON during the conduct of the study, as well as grants, personal fees, and nonfinancial support from Merck Serono, personal fees from Regeneron, Incyte, Sun Pharma, and Amgen, and grants from Alcedis outside the submitted work. R. Bech reports grants from Kyowa Kirin and personal fees from Recordati outside the submitted work. N. Ødum reports grants from The Danish Cancer Society, The Danish Research Fund, and The Novo Nordic Foundation and nonfinancial support from Micreos Pharmaceutical during the conduct of the study; and a patent for Treatment of Lymphoma (WO2025/093666) issued. No disclosures were reported by the other authors.

Figures
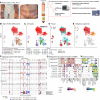
Figure 1.
Figure 1.
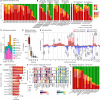
Identification of coexisting malignant subclones with distinct genomic, transcriptional, and surface proteomic signatures. A–H, Identification of malignant subclones from patient 17 with L-CTCL (PT17). A, Schematic depiction of our patient sample pipeline including matched skin and blood samples as well as pictures of the biopsied lesional skin of PT17. B to E, Uniform Manifold Approximation and Projections (UMAPs) of scTCR+CITE-seq colored by (B) top five most abundant T-cell clones based on TCRβ CDR3 sequence to identify clonal malignant population, (C) cell type annotation, (D) tissue of origin (skin or blood), and (E) malignant subclone assignment. Subclones are divided into major (denoted by letter suffix, i.e., “.A”) and minor (denoted by number suffix i.e. “.1”) depending on whether they cluster distinctly or appear intermixed in transcriptional space, respectively. F, Haplotype-aware CNA inference used to identify and validate malignant subclone assignment. Log fold change (log FC) track depicts transcription levels of genes sorted by genomic positions. pHF depicts loss of heterozygosity, validating CNA events at the sequence level. Boxes highlight subclonal CNA events including gain of chr7 and chr3p and loss of chr10 and chr16q for this patient. F and G, Differential gene (G) and surface protein (H) expression comparing malignant subclones and non-malignant CD4+ T-cell populations. Published markers of malignant CTCL cells are highlighted in bold, confirming the malignant identity and differential expression between subclones. (A, Created with BioRender.com). Act, activated; ILC, innate lymphoid cells; NK, natural killer cells; Resting, resting/naive T cell; T.CD4, CD4+ T cells; T.CD8, CD8+ T cells; Tcm, central memory T cell; Teff, effector T cell; Tem, effector memory T cell; Treg, regulatory T cell; Trm, tissue-resident memory T cell.
Figure 2.
Figure 2.
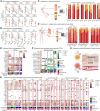
Coexisting malignant subclones with distinct genomic, transcriptional, and surface proteomic signatures are common in patients with L-CTCL. A and B, Quantification of malignant subclone abundance among total CD4+ T-cell population in blood of 57 patients with L-CTCL within (A) our cohort (named PT01 to PT23) and (B) seven additional cohorts from published studies. Highlighted bar shows subclonal abundance of PT17 identified in Fig. 1. Identification of malignant subclones from remaining patients in Supplementary Fig. S2. C, Distribution of patients with L-CTCL based on the number of subclones identified in their blood compartment colored by study cohort showing that coexisting malignant subclones are found in more than 80% of patients, irrespective of cohort. D, Average abundance distribution of the malignant subclones. Lines connect subclones from the same patient. Box and whiskers plot show Inter-Quantile-Range and median abundance of subclones as the percent of total malignant population. E, Aggregated CNA map across all included patients. Dark red and blue areas indicate CNAs that are only present in some but not all subclones within the patient (subclonal) whereas light red and blue areas indicate CNAs present in all subclones within the patient. F, Subclone abundance among total CD4+ T-cell population from blood taken at multiple time points across various treatments. Y-axis ticks are distributed every 25%. Initiated or ongoing treatment is noted below the patient identifier. Numbers to the right indicate the number of days between first and last sample time point. G, Subclonal signature genes (left) and surface proteins (right) from PT14 across two sampling time points at day 0 and 43. H, Subclone abundance among total CD4+ T-cell population in lesional skin biopsies. Subclone naming is based on subclone abundance in the matched blood of the patient, i.e., red bars denote the subclone that is dominant in the blood of the same patient. Black squares mark multiple biopsies from the same skin lesion.
Figure 3.
Figure 3.
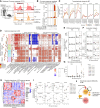
Genomic differences between malignant subclones by WGS. WGS analysis of FACS-sorted malignant and non-malignant cells from PBMCs of two patients with L-CTCL: PT03 (A–E) and PT13 (F–J). A and F, Gating scheme of viable (propidium iodide negative) cells for FACS-sorted malignant subclones. Black arrows indicate subgating. B and G, Post-sort purity of sorted malignant subclones. C and H, CNA analysis of WGS data (top) using CNVkit including variant allele frequencies for loss-of-heterozygosity detection. Top plots show log2 coverage and minor variant allele frequency colored by deviation from normal (diploid), indicating gains (red) or losses (blue) and copy-neutral loss of heterozygosity (green). The heatmap in the bottom shows inferred CNAs from scRNA-seq of the subclones included in the sorted population and annotated with their expected frequency within the sorted population. Black arrows indicate CNA events supporting minor subclones included in the gate. D and I, Venn diagram showing overlap of high-confidence (passing all GATK best-practice filters) somatic mutations with variant allele frequency > 10% (to exclude cross sample contaminants) between sorted subclones (left) and further filtered to only include variants with predicted moderate-to-high functional impact (stop-gained, missense, splice, or frameshift variants). E and J, Heatmap of variant allele frequencies for variants with predicted high impact (stop-gained, splice, or frameshift variants) across sorted subclones. Colored by variant allele frequency, symbols indicate variants’ consequences on gene products. VAF, variant allele frequency.
Figure 4.
Figure 4.
Malignant subclones exhibit differences in their tissue homing, spatial niche, and cytokine expression. A and B, mRNA expression of markers associated with (A) skin tissue or (B) lymphoid tissue homing or retention of T cells in subclones from the blood of 48 patients with L-CTCL. Subclones were ranked by their expression of each gene and the plot shows the highest and lowest expressing subclone from each patient (connected by lines). Y-axis displays psedobulk variance-stabilizing transformed (vst) counts, filtered to only show patients with at least a two-fold change in expression between highest and lowest ranked subclone (to avoid overcrowding). The number and percentage of patients (pts) with at least two-fold difference between highest and lowest ranked subclones are noted below each gene name. C and D, Subclone frequency of malignant population in matched blood and (C) whole skin or (D) skin from multiple lesions further separated into dermis and epidermis before scTCR+CITE-seq analysis. E and F, Summation of single-cell level (E) mRNA and (F) surface protein expression of skin or lymphoid homing and retention markers in matched blood and skin compartment samples from two lesions with distinct clinical presentation (erythroderma and plaque), both taken from PT09. Most tissue-homing markers are stable within subclones across lesion and tissue compartments and are consistent with residency in the compartment in which they are most abundant. G, Subclonal cytokine mRNA expression in matched blood and skin from 11 patients with L-CTCL segmented by individual subclone. Subclones exhibit different cytokine expression profiles with more cytokines being expressed in the skin than in the blood. H, Schematic of subclonal differences in cytokine production and tissue homing. Expression frequency above 40% is set to “40%+” to allow visualization of less frequent cytokines (Created with BioRender.com).
Figure 5.
Figure 5.
Coexisting malignant subclones differ in their metabolism and cell-to-cell signaling including cytokine- and TCR–NF-kB axes. A and B, Pathway gene set enrichment analysis of differentially expressed genes (DEG) between coexisting subclones within each patient (x-axis) for (A) blood and (B) skin compartment. Only pathways annotated in the Reactome database were included in the analysis. Circles indicate that a pathway is significantly different between coexisting subclones within the patient and color depicts normalized enrichment score (NES). Bar plots show the percentage of patients in which this pathway is significantly different between coexisting subclones. P values below 10−5 were set to 10−5 and NES above 3 were set to 3 to allow better visualization of all pathways on the same scale. Additional pathway categories are shown in Supplementary Fig. S10. C, Inference of cell-to-cell interaction between malignant subclones (as recipients) and local microenvironment (as senders) in lesional skin from 11 patients with L-CTCL. Circles indicate the number of potential interactions between malignant subclone (expressing cognate receptors) and other cell populations in the skin (expressing corresponding ligands). The bar plot indicates the total interaction weight as a measure of each subclone’s potential to receive signals from its microenvironment. D, Comparison between the subclones ranked by having highest or lowest total interaction weight showing that the subclone most dominant in blood is often not the subclone with highest interaction potential in the skin [by definition, subclone A (colored red) is the most frequent subclone in blood]. E, Correlation between total interaction weight of the subclones and the percentage of MKI67-positive cells as a measure of active cell proliferation. Circles show subclonal frequency among all malignant cells in the skin. F, Schematic of subclonal differences in cell-to-cell signaling in lesional skin (Created with BioRender.com).
Figure 6.
Figure 6.
Coexisting malignant subclones respond qualitatively differently to exposure to S. aureus and their toxins. A, Subclonal activation of PT17 upon exposure to supernatants (sup.) from CTCL patient–derived S. aureus cultured in the presence or absence of S. aureus–specific bacteriolytic endolysin (XZ.700). Malignant cells are gated as CD3+CD4+CD26CD7. Subclones A and B are gated as CD39+/−CD73 and CD39CD73+, respectively (see Fig. 1H). Cell activation is measured by upregulation of CD25 (IL2Rα) and an increase in forward scatter (FSC) reflecting blasting (increased cell size). B, Subclonal activation of PT11 upon exposure to the supernatant from two CTCL patient–derived S. aureus cultures that either contain S. aureus enterotoxins (SE; w. SE) or do not (no SE) in the presence or absence of a pharmacologic Src inhibitor (A-419259) which blocks proximal signaling through the TCR. Activation and proliferation measured by upregulation of CD25, blasting, and dilution of CellTrace Violet (CTV), respectively. C, Overall transcriptional change within malignant subclones from six patients with L-CTCL induced by the presence of SE after 4, 24, 48, 72, and 144 hours of culture. Within each subclone at each time point, total transcriptional change was calculated as the sum of absolute log2 fold change of all genes when comparing SE- and PBS-treated cells. D, Pathway gene set enrichment analysis of differentially expressed genes induced by the presence of SE at peak stimulation (36–72 hours) from 16 patients with L-CTCL, dividing malignant subclones into four distinct SE response groups. Circles indicate that a pathway is significantly (P value ≤ 0.01) induced (red) or repressed (blue) by SE in the given subclone and color depicts normalized enrichment score (NES). Connected boxes to the left show coexisting subclones from the same patient, showing that patients often have subclones in multiple SE response groups. To allow better visualization of all pathways on the same scale, P values below 10−8 were set to 10−8 and NES above or below 2.5 were set to 2.5 or −2.5, respectively. To allow visualization, all pathways are not shown here but can also be found in Supplementary Fig. S12. Clustering of subclones into SE response groups is based on all significant pathways. E–G, Subclonal activation response by the SE response group of (E) TCR-induced and (F) other activation-induced surface protein markers as well as (G) percent proliferating (MKI67+) cells. Each dot represents a single subclone and is colored by patient. H and I, Baseline ex vivo expression signature of subclones from each of the four SE response groups shown as a (H) rowscaled heatmap and (I) pseudobulk counts per million (cpm) for a selection of signature genes. Selected genes are highlighted as bold in the heatmap. Each dot represents a single subclone and is colored by patient. J, Schematic of the subclonal differences in response to extrinsic factors such as S. aureus and their enterotoxins (Created with BioRender.com).
Figure 7.
Figure 7.
Subclonal differences in extrinsic-induced aggressiveness are linked to their intrinsic drug resistance. A and B, Example of selective subclonal sensitivity to romidepsin treatment in PT17 showing marked reduction of viable cells (negative for both annexin V and propidium iodide) only in subclone A and not in subclone B or non-malignant CD4+ T cells (NM), shown as (A) representative flow cytometry plots and (B) quantification of percent viability and relative counts. Malignant cells are gated as CD3+CD4+CD26CD7. Subclones A and B are gated as CD39+/−CD73 and CD39CD73+, respectively (see Fig. 1H). C and D, Transcriptional response of PT17 to ex vivo romidepsin treatment for 36 hours (versus DMSO control) prior to induction of cell death, showing (C) volcano plot with more differentially expressed genes and (D) higher overall transcriptional response in subclone A as compared with subclone B and non-malignant CD4+ T cells. Highlighted gene names in volcano plot show the top five up- and downregulated genes that are only above the 1.5-fold change threshold in the given population. Total transcriptional change was calculated as the sum of absolute log2 fold change of all genes when comparing romidepsin- and DMSO-treated cells. E, Subclonal sensitivity to ex vivo treatment with cancer drugs for 72 hours and analyzed by flow cytometry. Y-axis denotes the percent of cells remaining as compared with DMSO control calculated as the relative reduction of subclonal cell counts in treatment versus DMSO samples. Coexisting subclones from identical SE response groups that could not be clearly separated by included surface markers are included as a single point. F, Average subclonal expression of genes encoding targets for biologics treatment. Expression is shown as log2 psedobulk variance-stabilizing transformed (vst) counts. G, Subclonal sensitivity to ex vivo treatment with cancer drugs for 72 hours in the presence of SE and analyzed by flow cytometry showing induction of drug resistance in otherwise sensitive subclones for romidepsin but not for bortezomib known to block NF-κB signaling. Y-axis denotes the percentage of cells remaining as compared with DMSO control, calculated as the relative reduction of subclonal cell counts in treatment versus DMSO samples. Each dot represents a single subclone and is colored by patient. H, Schematic of subclonal balance between responsiveness to extrinsic factors such as SE and intrinsic drug resistance (Created with BioRender.com).

References

    1. Turner NC, Reis-Filho JS. Genetic heterogeneity and cancer drug resistance. Lancet Oncol 2012;13:e178–85. - PubMed
    1. Latzka J, Assaf C, Bagot M, Cozzio A, Dummer R, Guenova E, et al. EORTC consensus recommendations for the treatment of mycosis fungoides/Sézary syndrome - update 2023. Eur J Cancer 2023;195:113343. - PubMed
    1. Agar NS, Wedgeworth E, Crichton S, Mitchell TJ, Cox M, Ferreira S, et al. Survival outcomes and prognostic factors in mycosis fungoides/sézary syndrome: validation of the revised International Society for Cutaneous Lymphomas/European Organisation for Research and Treatment of Cancer staging proposal. J Clin Oncol 2010;28:4730–9. - PubMed
    1. Choi J, Goh G, Walradt T, Hong BS, Bunick CG, Chen K, et al. Genomic landscape of cutaneous T cell lymphoma. Nat Genet 2015;47:1011–9. - PMC - PubMed
    1. da Silva Almeida AC, Abate F, Khiabanian H, Martinez-Escala E, Guitart J, Tensen CP, et al. The mutational landscape of cutaneous T cell lymphoma and Sézary syndrome. Nat Genet 2015;47:1465–70. - PMC - PubMed

MeSH terms

LinkOut - more resources