Comparative Study
. 2025 Sep:67:101185.
doi: 10.1016/j.neo.2025.101185. Epub 2025 Jun 13.

Comparative effects of combustible cigarette versus electronic cigarette exposures on KRAS mutant lung cancer promotion

Affiliations
Comparative Study

Comparative effects of combustible cigarette versus electronic cigarette exposures on KRAS mutant lung cancer promotion

Walter V Velasco et al. Neoplasia. 2025 Sep.

Abstract

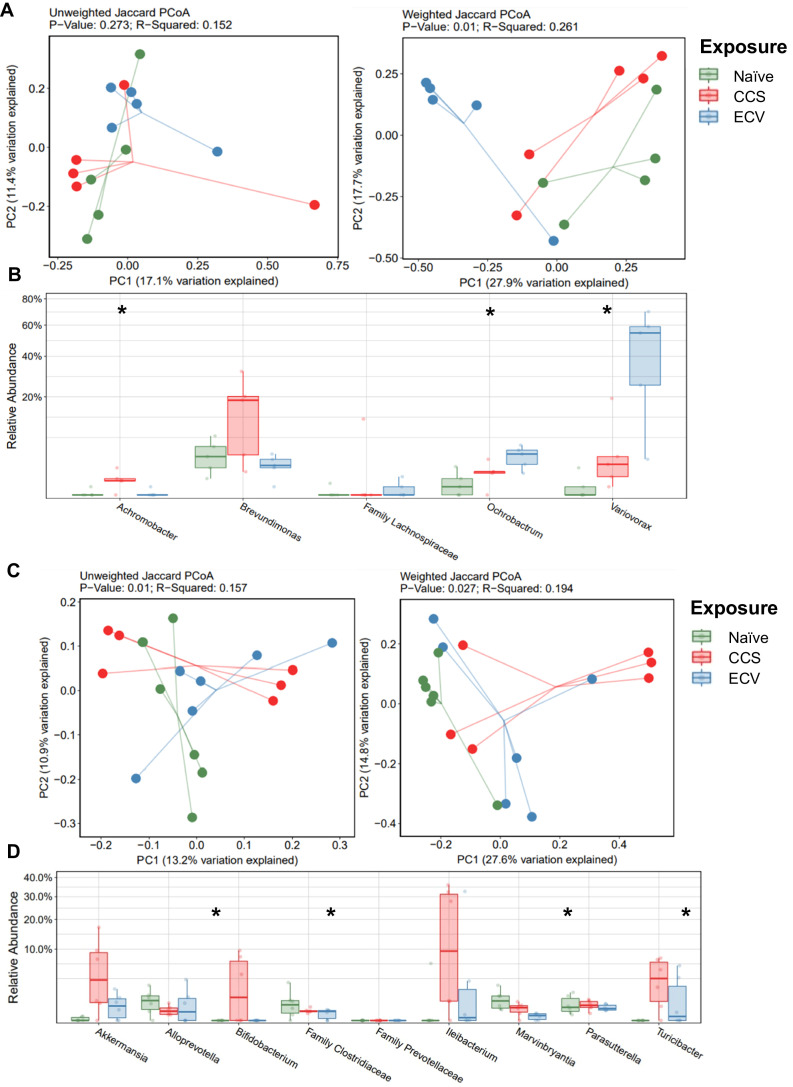
Despite the emerging public health concern related to the use of electronic cigarette vapors (ECV), its impact on lung cancer is poorly understood. We assessed the effect of ECV on lung tumorigenesis in a mouse model of lung adenocarcinoma. Mice were exposed to either room air, combustible cigarette smoke (CCS), or ECV 2 hours daily for 8 weeks at which lung samples were harvested and studied for different outcomes. We found that CCS, but not ECV, led to a significant increase in tumor burden. Immunophenotyping of both CCS- and ECV-exposed lungs displayed pronounced pro-tumor immunosuppressive phenotypes, characterized by significantly decreased CD4+ IFNγ+ and CD8+ GZMB+ T cells along with an elevated CD4+ FOXP3+ regulatory T cells. However, differential changes in myeloid cells were observed between CCS and ECV-exposed lungs. A microbiome profiling of matched stool and lung samples showed differences in the relative abundance of lung Pseudomonadotas, while gut Bacillota, particularly Turicibacter, and Ileibacterium were increased by CCS and ECV. We conclude that both CCS and ECV exposure under the applied regimen lead to a protumor immune suppressive lung microenvironment although with different magnitudes and slightly different phenotypes that might explain their differential effects on tumor burden warranting further studies.

Keywords: Cigarette smoke; Electronic cigarette; Kras; Lung cancer; Microbiome.


Conflict of interest statement

Declaration of competing interest The authors declare the following financial interests/personal relationships which may be considered as potential competing interests: SJM reports past funding from Arrowhead Pharma and Boehringer Ingelheim outside the submitted work.

Figures

Fig 1
Fig. 1
Experimental design and exposure regimen validation. (A) Mice were whole-body exposed to either room air, CCS, or ECV beginning at 6 weeks of age for 8 weeks and dissected at 14 weeks of age. Mice were exposed for 2 hours each day for 5 days per week. Schematic created with BioRender. (B) Serum cotinine levels from air, CCS, and ECV-exposed mice, expressed in ng/mL (n = 4-6). (C) Serum 8-OHdG levels from the air, CCS, and ECV-exposed mice expressed in ng/mL (n = 4-6). (D) Superoxide dismutase activity levels from air, CCS, and ECV-exposed mice, expressed as a percentage of enzyme inhibition achieved per group (n = 4-6).
Fig 2
Fig. 2
CCS led to a significant increase in tumor burden, while ECV showed no significant changes compared to room air-exposed control. (A) The number of tumors visualized on the surface of the lungs during dissection at 14 weeks of age (n = 6-8). (B) H&E stained tissue sections are visualized as stitched 4X images of the whole section or 20X images of representative tumor lesions. (C) Quantification of percent tumor area in whole tumor cross-section (n = 4). (D) 40X images of Ki67 Immunohistochemistry staining. (E) Quantification of percent Ki67+ nuclei within tumor lesion (n = 4). (F) 40X images of ERG Immunohistochemistry staining. (G) Quantification of percent ERG+ nuclei within tumor lesion (n = 4). (H) 40X images of CC3 Immunohistochemistry staining. (I) Quantification of percent CC3+ nuclei within tumor lesion (n = 4).
Fig 3
Fig. 3
CCS and ECV differentially modulate myeloid populations in the tumor immune microenvironment. (A) Differential cell counts of infiltrating immune cells in bronchoalveolar lavage fluid (n = 3-5). (B-E) Flow cytometry evaluation of cDC1, cDC2, and monocyte DCs in homogenized lung tissue (n = 3-8). (F-G) Flow cytometry evaluation of neutrophils in homogenized lung tissue (n = 3-8). (H-J) Flow cytometry evaluation of polymorphonuclear and monocytic myeloid-derived suppressor cells in homogenized lung tissue (n = 3-8).
Fig 4
Fig. 4
Immunophenotyping of both CCS and ECV-exposed lungs displayed pronounced pro-tumor immunosuppressive phenotypes. (A-D) Flow cytometry evaluation of CD8+ cytotoxic T cells that express IFN-γ or Granzyme-B in homogenized lung tissue (n = 3). (E-F) Flow cytometric evaluation of FoxP3+ regulatory T cells in homogenized lung tissue (n = 3). (G-J) Quantitative PCR evaluation of NOS2, IFNG, ARG1, and IL-10 in homogenized lung tissue (n = 3-4).
Fig 5
Fig. 5
Lung and stool of CCS and ECV-exposed mice showed microbial dysbiosis in comparison to naïve controls. (A) Evaluation of beta-diversity using unweighted and weighted Jaccard from lungs of cancer-bearing mice exposed to room air, CCS, or ECV (n = 5-6). (B) Evaluation of the relative abundance of the top 5 taxa with the smallest p-value from lungs of cancer-bearing mice exposed to room air, CCS, or ECV (n = 5-6). (C) Evaluation of beta-diversity using unweighted and weighted Jaccard from the stool of cancer-bearing mice exposed to room air, CCS, or ECV (n = 6). (D) Evaluation of the relative abundance of the top 9 taxa with the smallest p-value from stools of cancer-bearing mice exposed to room air, CCS, or ECV (n = 6).
Fig 6
Fig. 6
Exposure to CCS and ECV results in profound changes in host and microbial metabolism. A) Bar plot illustrating metabolic pathways enriched by Metabolite Set Enrichment Analyses (MSEA) of differential (one-way ANOVA p < 0.05) metabolites identified in plasma of CCS, ECV, or room air (naïve) exposed wild-type mice. Additional information is provided in Supplemental Table S1. B) Bar plots showing differences in plasma purine levels between CCS-, ECV-, or room air (naïve)-exposed wild-type mice. C) Bar plots showing differences in microbial-derived indole-3-lactate and indole-3-acetylaldehyde in plasma of CCS-, ECV-, or room air-exposed wild-type mice. D) Heatmap illustrating lipid species that were significantly elevated in CCS-exposed (top panel) or ECV-exposed (bottom panel) wild-type mice. E) Bar plots depicting levels of cardiolipins (CL) in lung samples from CCS-, ECV-, or room air (naïve)-exposed wild-type mice.

Similar articles

References

    1. Ferlay J., Soerjomataram I., Dikshit R., Eser S., Mathers C., Rebelo M., et al. Cancer incidence and mortality worldwide: sources, methods and major patterns in GLOBOCAN 2012. Int. J. Cancer. 2015;136(5):E359–E386. - PubMed
    1. Mannino D.M., Aguayo S.M., Petty T.L., Redd S.C. Low lung function and incident lung cancer in the United States: data from the first national health and nutrition examination survey follow-up. Arch. Intern. Med. 2003;163(12):1475–1480. - PubMed
    1. Islami F., Marlow E.C., Thomson B., McCullough M.L., Rumgay H., Gapstur S.M., et al. Proportion and number of cancer cases and deaths attributable to potentially modifiable risk factors in the United States. CA Cancer J. Clin. 2019:2024. - PubMed
    1. Jia B., Zheng Q., Wang J., Sun H., Zhao J., Wu M., et al. A nomogram model to predict death rate among non-small cell lung cancer (NSCLC) patients with surgery in surveillance, epidemiology, and end results (SEER) database. BMC Cancer. 2020;20(1):666. - PMC - PubMed
    1. Youlden D.R., Cramb S.M., Baade P.D. The International Epidemiology of Lung Cancer: geographical distribution and secular trends. J. Thorac. Oncol. 2008;3(8):819–831. - PubMed

Publication types