

Preliminary evaluation of smartphone-based addition measurement in a presbyopic population
- PMID: 40516221
- PMCID: PMC12205635
- DOI: 10.1016/j.optom.2025.100561
Preliminary evaluation of smartphone-based addition measurement in a presbyopic population
Abstract
Purpose: To evaluate the viability and accuracy of a mobile application (app) for subjective measurement of presbyopic addition, comparing its performance with standard clinical methods.
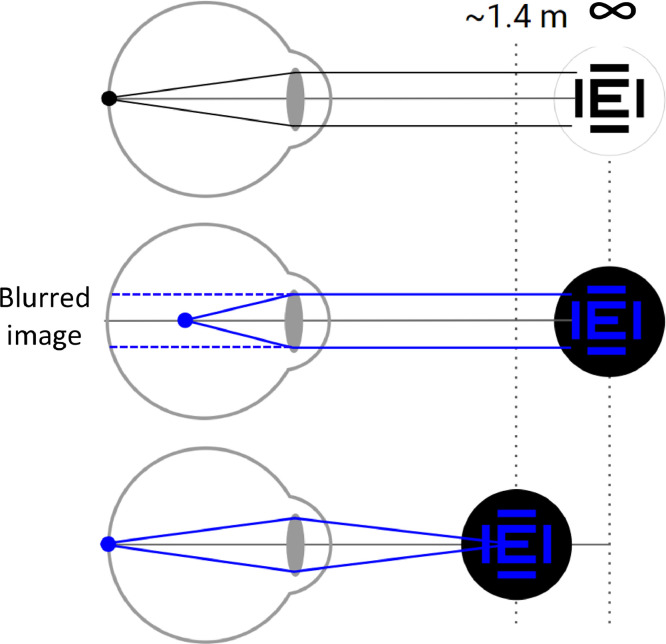
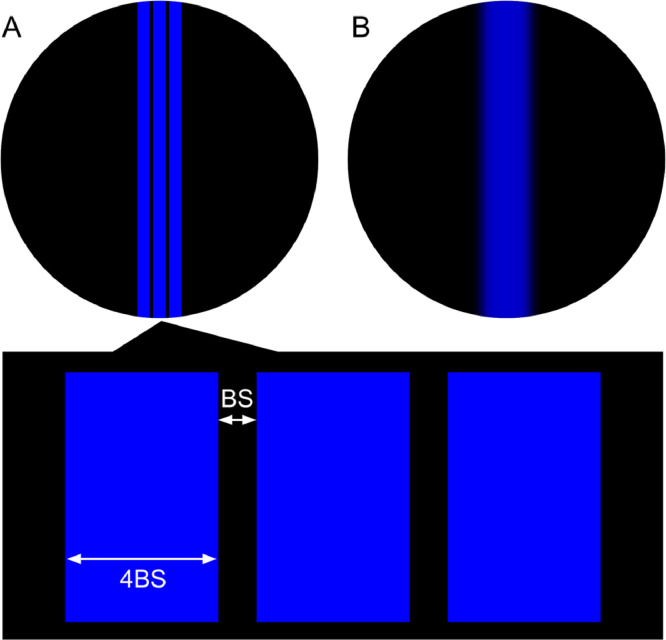
Methods: Twenty presbyopic subjects (aged 52 to 64) participated in the study. Clinical measurements of sphero-cylindrical refraction and its correction was achieved using trial lenses. Addition was also clinically measured using a standard and a tentative method. A set of 12 trial lenses ranging from 0 to 2.75 D were randomly put on top of the far distance correction, generating the correction addition correction or different levels of under/over correction of the addition. Participants then used a smartphone-based app to subjectively determine binocularly their near point (NP) using a push-up method while looking at a blue stimulus that rescaled as a function of the face-device distance measured using the front camera of the device. For each induced level of under/over correction of the addition, participants completed three measurements of their near point.
Results: Linear regression analysis showed a strong correlation (R² = 0.82) between app-measured and clinical addition values. Bland-Altman analysis revealed a mean over estimation of -0.22± 0.38 D with a limit of agreement of ±0.74 D of the near correction. Cumulative error analysis indicated that 61.7 % of app measurements were within 0.25 D of clinical values, and 82.5 % within 0.50 D CONCLUSIONS: A smartphone-based subjective measurement of presbyopic addition can potentially be used to assess the addition needed to detect the under or over corrected addition in full presbyopic subjects.
Keywords: Accommodation; Addition; Near point; Presbyopia; Smartphone.
Copyright © 2025 The Author(s). Published by Elsevier España, S.L.U. All rights reserved.
Conflict of interest statement
Conflict of interest N López-Gil: cofounders, patent author and consultant of VisionApp Solutions M Jaskulski: cofounders, patent author and employee by VisionApp Solutions RM Salmerón-Campillo, G Martinez-Ros and JA Diaz-Guirado: employee by VisionApp Solutions
Figures


Similar articles
-
Optical correction of refractive error for preventing and treating eye symptoms in computer users.Cochrane Database Syst Rev. 2018 Apr 10;4(4):CD009877. doi: 10.1002/14651858.CD009877.pub2. Cochrane Database Syst Rev. 2018. PMID: 29633784 Free PMC article.
-
Accuracy and precision of a sphero-cylindrical over-refraction app for smartphones.Ophthalmic Physiol Opt. 2025 Aug 1. doi: 10.1111/opo.13560. Online ahead of print. Ophthalmic Physiol Opt. 2025. PMID: 40747810
-
Mobile health (m-health) smartphone interventions for adolescents and adults with overweight or obesity.Cochrane Database Syst Rev. 2024 Feb 20;2(2):CD013591. doi: 10.1002/14651858.CD013591.pub2. Cochrane Database Syst Rev. 2024. PMID: 38375882 Free PMC article.
-
Trifocal intraocular lenses versus bifocal intraocular lenses after cataract extraction among participants with presbyopia.Cochrane Database Syst Rev. 2023 Jan 27;1(1):CD012648. doi: 10.1002/14651858.CD012648.pub3. Cochrane Database Syst Rev. 2023. PMID: 36705482 Free PMC article.
-
Computer and mobile technology interventions for self-management in chronic obstructive pulmonary disease.Cochrane Database Syst Rev. 2017 May 23;5(5):CD011425. doi: 10.1002/14651858.CD011425.pub2. Cochrane Database Syst Rev. 2017. PMID: 28535331 Free PMC article.
References
-
- Legrand Y. Optique physiologiqueTome 1. Éditions de la Revue d’Optique; Paris: 1952.
-
- Online Etylology Dictionary . 2025. resbyopia.https://www.etymonline.com/word/presbyopia Accessed June 5, 2025.
-
- Holden B.A., et al. Global vision impairment due to uncorrected presbyopia. Arch. Ophthalmol. 2008;126:1731–1739. - PubMed
-
- Mena Roa, M. Statista. La tercera edad en Españahttps://es.statista.com/grafico/23071/poblacion-mayor-de-65-anos-como-po... número de personas mayores,54 %25 de la población mundial (2022).
MeSH terms
LinkOut - more resources
Full Text Sources
Medical
Miscellaneous
