. 2025 Aug 20;113(16):2656-2672.e13.
doi: 10.1016/j.neuron.2025.05.023. Epub 2025 Jun 13.

Major-depressive-disorder-associated dysregulation of ZBTB7A in orbitofrontal cortex promotes astrocyte-mediated stress susceptibility

Affiliations

Major-depressive-disorder-associated dysregulation of ZBTB7A in orbitofrontal cortex promotes astrocyte-mediated stress susceptibility

Sasha L Fulton et al. Neuron. .

Abstract

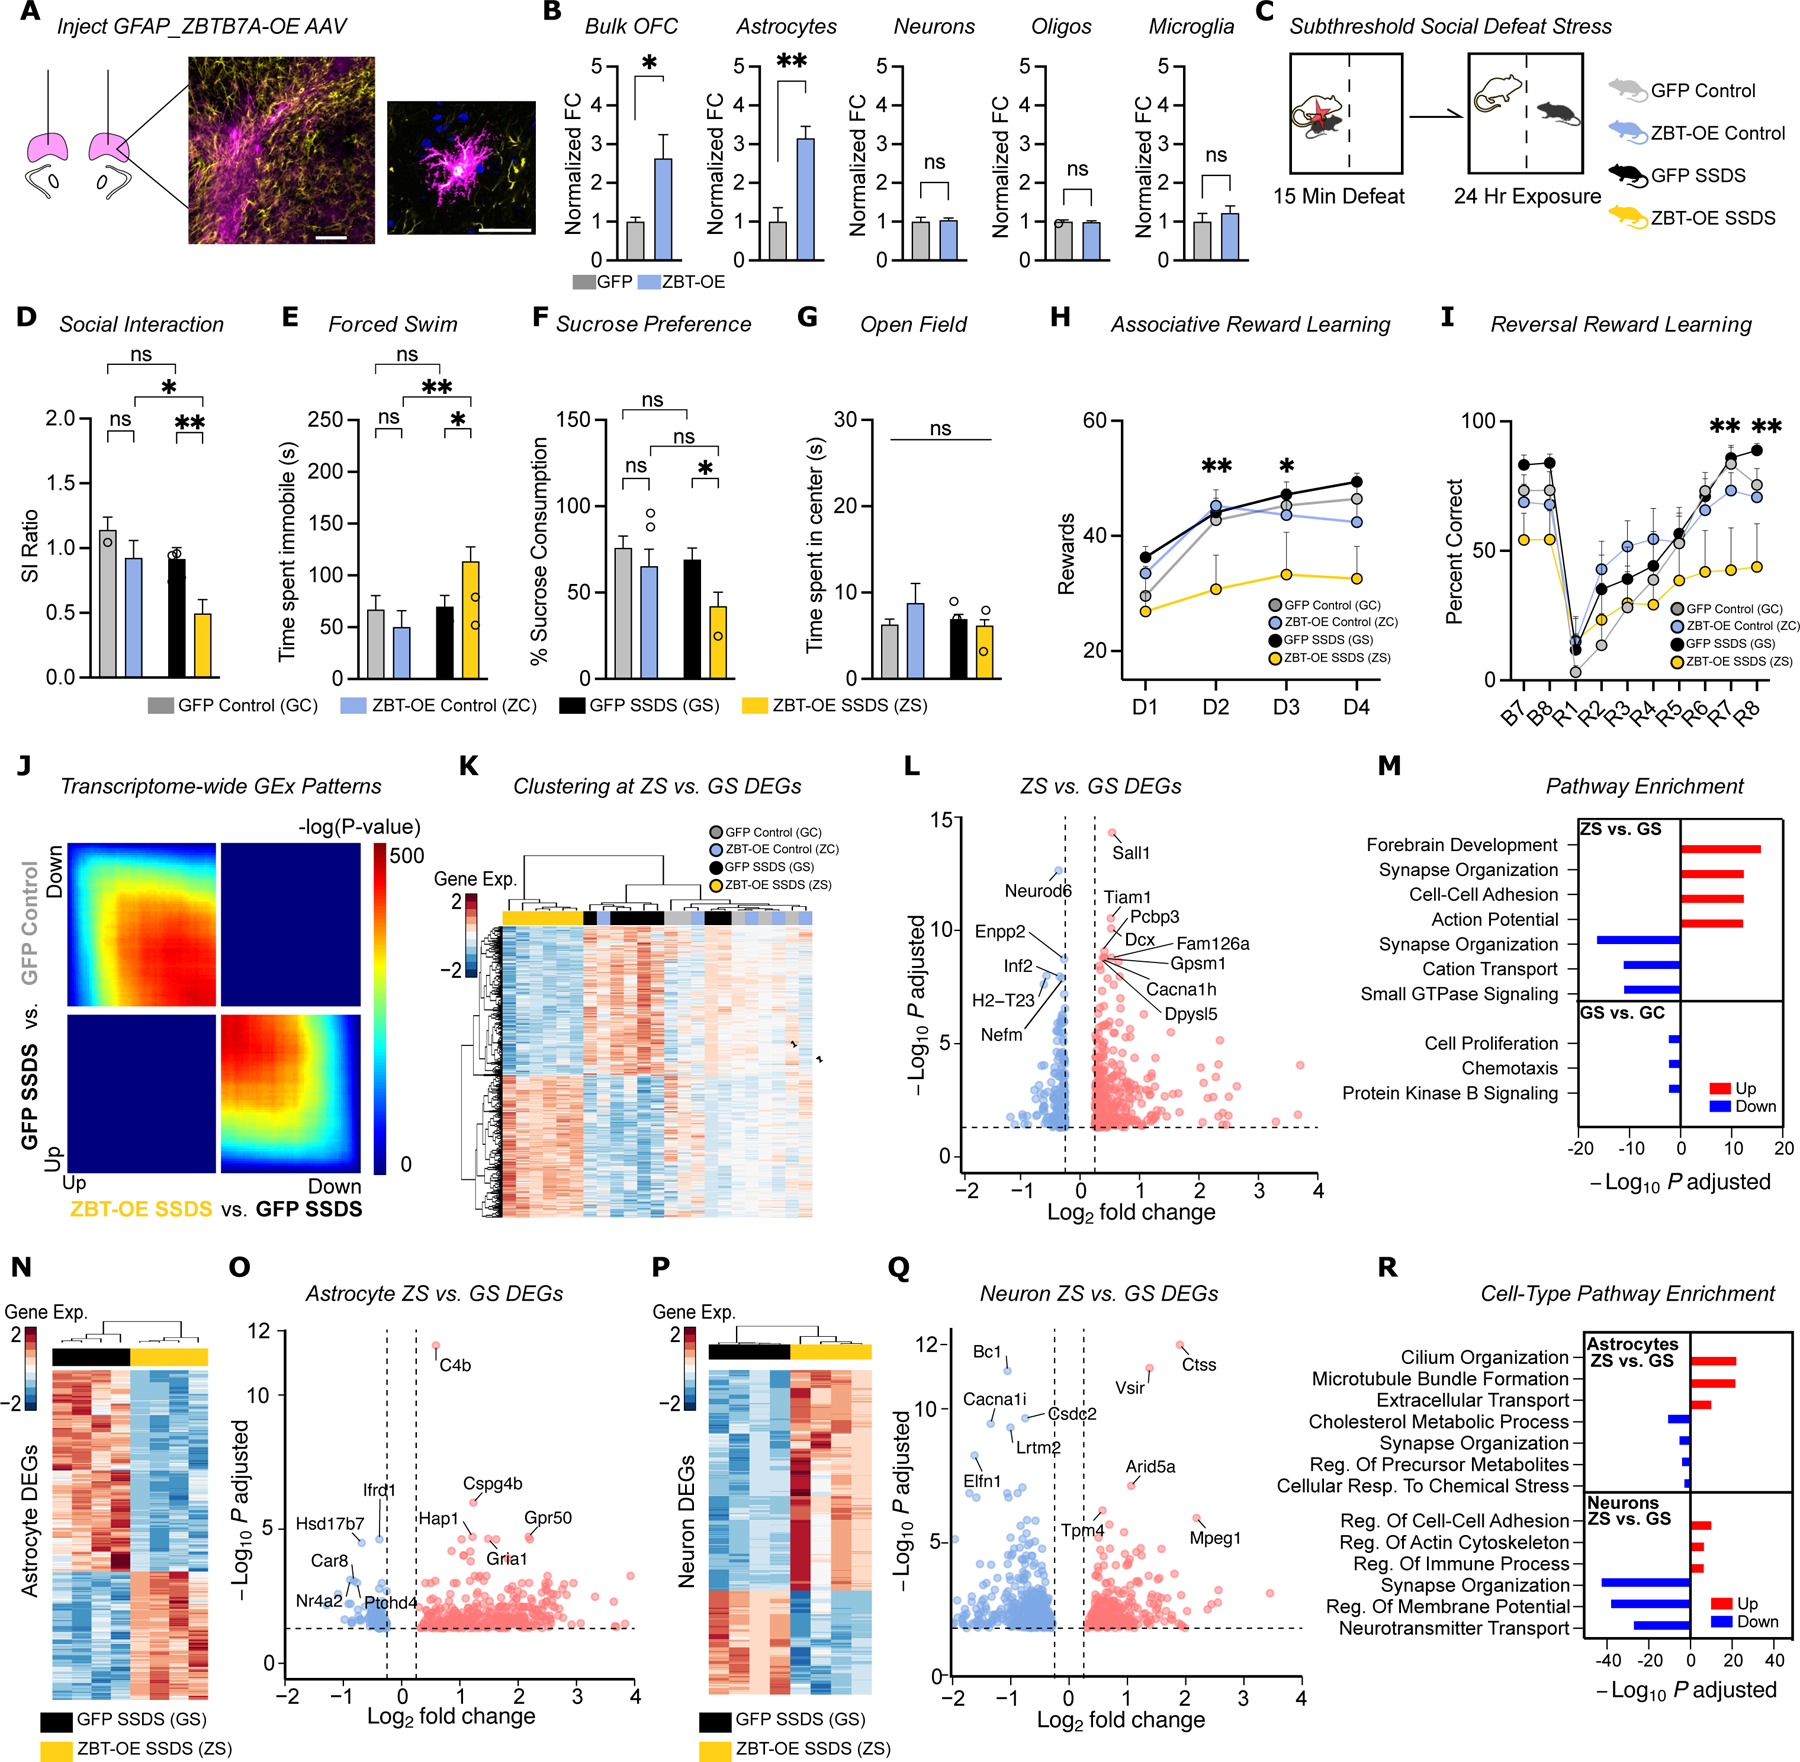
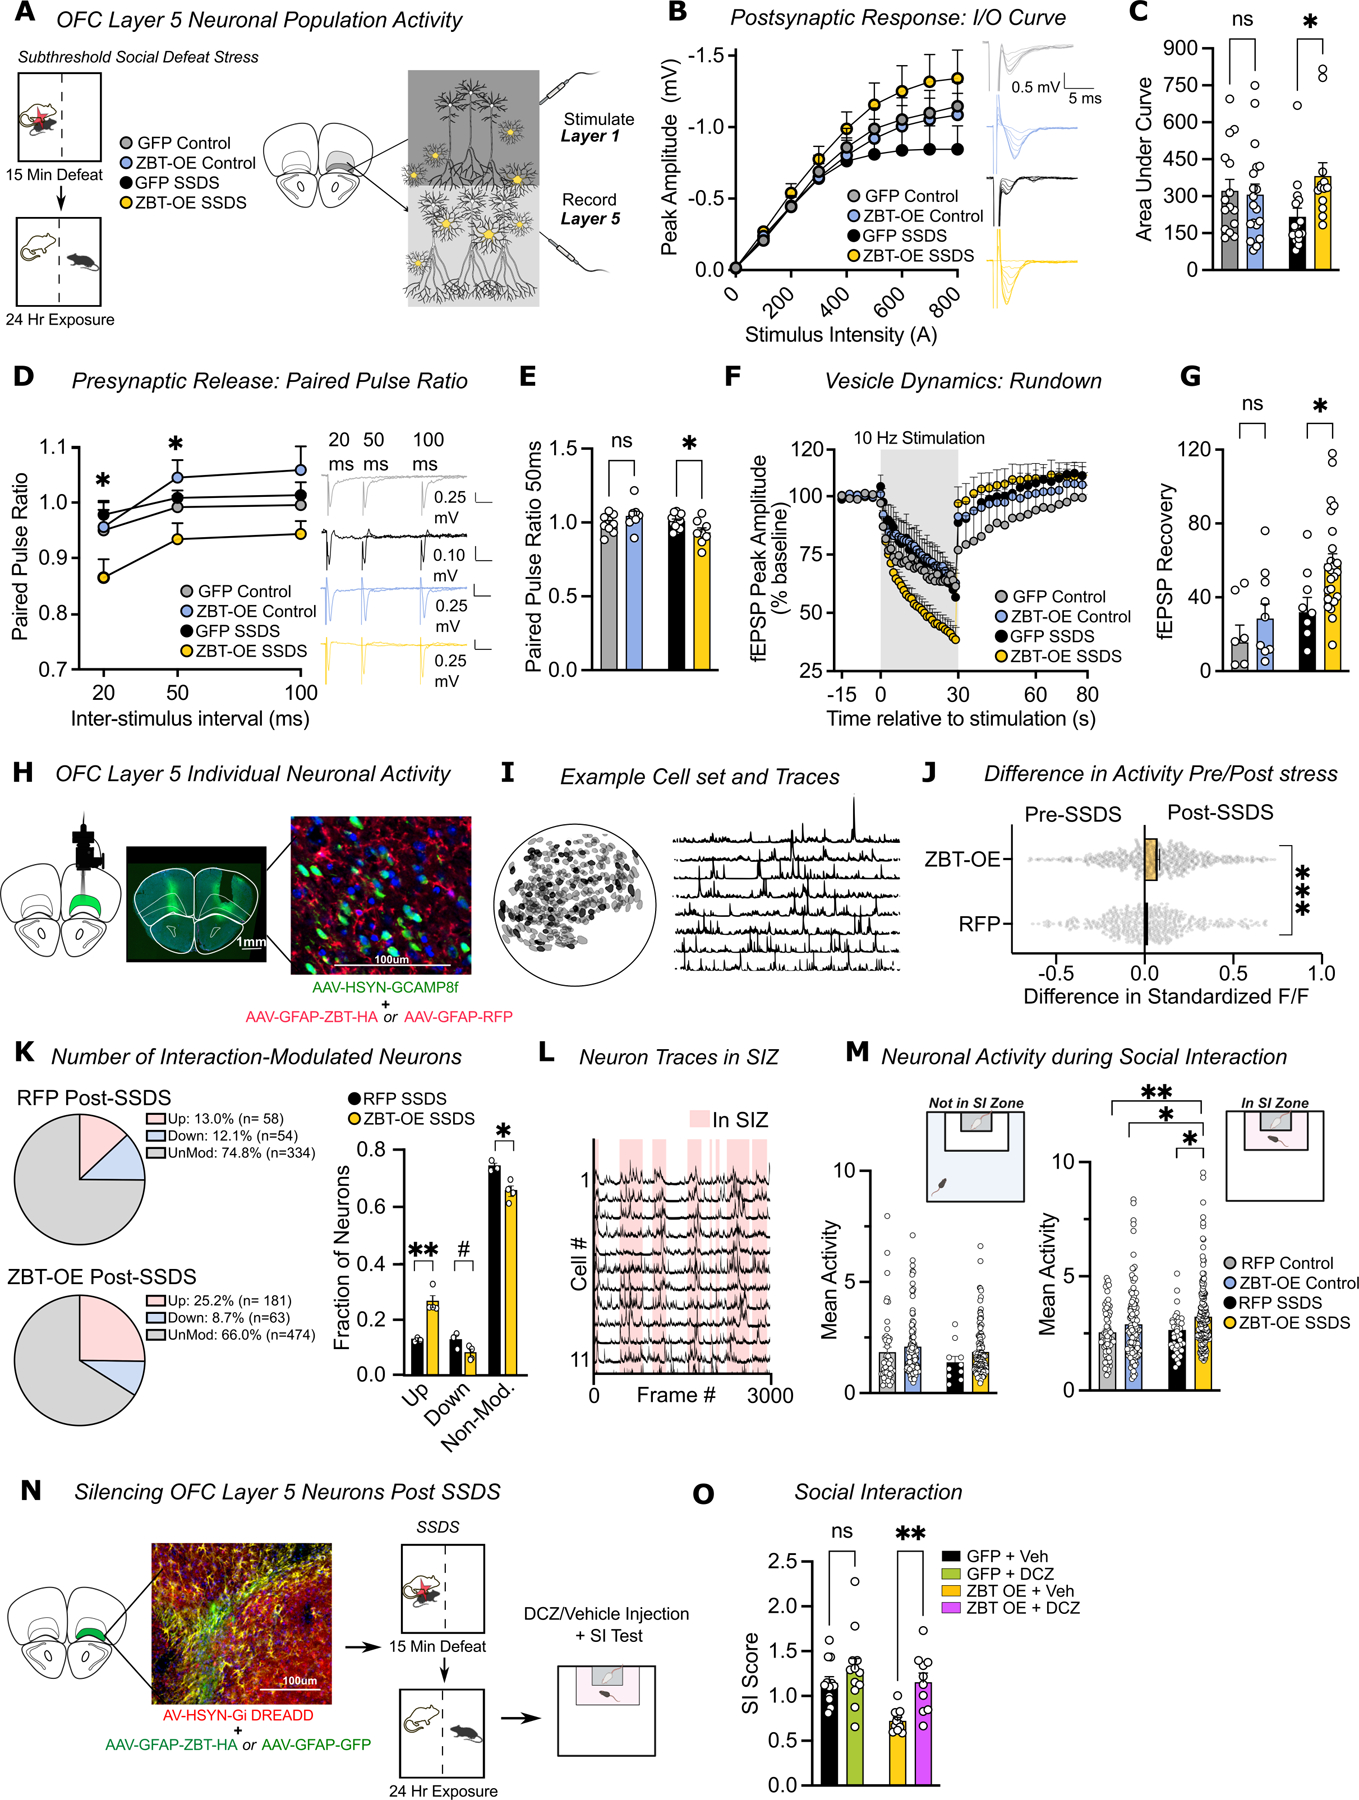
Heightened activity in the orbitofrontal cortex (OFC), a brain region that contributes to motivation, emotion, and reward-related decision-making, is a key clinical feature of major depressive disorder (MDD). However, the cellular and molecular substrates underlying this dysfunction remain unclear. Here, we performed cell-type-specific profiling of human OFC and unexpectedly mapped MDD-linked epigenomic features (including genetic risk variants) to non-neuronal cells, revealing significant glial dysregulation in this region. Characterization of MDD-specific chromatin loci further identified ZBTB7A-a transcriptional regulator of astrocyte reactivity-as an important mediator of MDD-related alterations. In rodent models, we found that Zbtb7a induction in astrocytes is both necessary and sufficient to drive stress-mediated behavioral deficits, cell-type-specific transcriptional/epigenomic signatures, and aberrant OFC astrocyte-neuronal communication in male mice-an established MDD risk factor. These findings thus highlight essential roles for astrocytes in OFC-mediated stress susceptibility and identify ZBTB7A as a critical and therapeutically relevant regulator of MDD-related OFC dysfunction.

Keywords: ZBTB7A; anhedonia; astrocyte-neuron communication; astrocytes; chronic social defeat stress; epigenomics; major depressive disorder; orbitofrontal cortex.


Conflict of interest statement

Declaration of interests I.M. and S.L.F. are co-inventors on a submitted patent application entitled “Treatment of major depressive disorder by inhibition of zinc finger and BTB domain-containing protein 7A (ZBTB7A) using miRNAs.”

Figures

Fig. 1.
Fig. 1.. Transcriptomic and chromatin accessibility profiling identifies glial regulatory signatures of human MDD in OFC.
(A) Clustering of MDD case and control samples at 1,412 differentially expressed genes (DEGs) (FDR < 0.1). (B) Dynamic tree cut graph visualizing the co-expressed gene networks identified in human RNA-seq by weighted gene correlation network analysis (WGCNA) [top] and heatmap depicting each network’s Pearson’s correlation with MDD diagnosis [bottom]. * indicates Adj. P <0.05 significant correlation. (C) Gene Ontology (GO) analysis and Cell-type Enrichment for genes in each significantly MDD-correlated network. (D) Number of detected Open Chromatin Region (OCR) sets stratified by genomic context. (E) Overlap of OCR sets with a reference study of lineage-specific brain open chromatin atlas. (F) Enrichment of MDD-linked genetic variants within OCR sets by LD-score regression. (G) Clustering of MDD case and control non-neuronal samples at 203 MDD-specific OCRs (rows). (H) Overlap between GO and Reactome Pathway (Re) gene sets with the set of 203 MDD-specific OCRs. Dashed line indicates FDR = 0.05.
Fig. 2.
Fig. 2.. Identification of ZBTB7A as a key transcription factor regulating MDD-specific OCRs in OFC.
(A) Distribution of the discovered motif enriched in MDD-specific OCRs. (B) Top 10 most significant GO terms for gene targets of OCRs containing the discovered motif. (C) Correlation coefficients and percent alignment between candidate TF motifs and the discovered motif. (D) Percent expression of candidate TF genes (CT value) over reference gene (HPRT1). “n.d.” indicates not detected. (E) ZBTB7A mRNA in OFC postmortem human tissues (MDD, n = 20 vs. control, n = 19) samples. (F) ZBTB7A protein in bulk OFC postmortem human tissues (MDD, n=15 vs. control, n=12) samples]. See western blot film scans in Figure S6B–C. (G) Enrichment of terms in CellMarker Augmented Database and ChEA ENCODE Consensus database for downregulated MDD DEGs. (H) Aggregated footprint scores across ZBTB7A sites in MDD or control nuclei populations. (I) Number of bound ZBTB7A sites detected exclusively in MDD or control neuronal vs. non-neuronal nuclei [right] and in all non-neuronal/neuronal nuclei [left]. (J) Representative traces of cell specific ATAC-seq signal overlapping PRR5L locus at four OCRs, with the only significantly dysregulated OCR between MDD and control (FDR<0.05) overlapping two ZBTB7A TFBS. (K) Social interaction (SI) ratio score for control (n = 8) vs. CSDS susceptible (n = 11) vs. CSDS resilient mouse (n = 9) groups (L) Protein expression of Zbtb7a in mouse OFC bulk tissues: control vs. susceptible vs. resilient groups. See raw western blot film scans in Figure S6D–E. (M) Correlation between SI score and Zbtb7a protein expression. (N) Zbtb7a protein expression in mouse OFC bulk tissues, control (n=11) vs. susceptible (n=14) at 21 days post-CSDS. See western blot film scans in Figure S6F–G. (O-R) Zbtb7a mRNA expression in MACs-isolated cells from chronically stressed OFC mouse tissues vs. control, n=4/group: (O) astrocytes, (P) neurons, (Q) microglia, and (R) immature oligodendrocytes. (S-U) FPKM values for Zbtb7a mRNA in CSDS astrocyte-specific TRAP-seq data set [GSE139684], n=3–5/group: (S) OFC (T) Nucleus Accumbens (U) Hippocampus. For all graphs, data are mean ± SEM. One-way ANOVA with Tukey’s multiple comparisons test: ∗∗∗∗p < 0.0001, ∗∗∗p < 0.001, ∗∗p < 0.01, ∗p < 0.05; ns, not significant. Full statistics information is provided in the Supplemental Table S7_stats.
Fig. 3.
Fig. 3.. Astrocyte-specific ZBTB7A OE in mouse OFC is sufficient to induce behavioral and molecular signatures of stress susceptibility.
(A) Schematic of AAV6-GFAP-ZBTB7A-OE injection into OFC with example histology of virus expression. (B) Zbtb7a mRNA in bulk OFC tissue, MACs-isolated astrocytes, neurons, oligodendrocytes, and microglia from AAV6-GFAP-ZBT-OE transduced OFC tissues, n=2–4/group. (C) Schematic of experimental groups resulting from SSDS paradigm performed after AAV injection into OFC (D) Social interaction ratio. (E) Time spent immobile in Forced Swim test. (F) Percent sucrose consumed during the Sucrose Preference Test. (G) Time spent in center during open field test. (H) Performance in cue-reward association task. “D” indicates day of test. 3-way ANOVA, Virus x Stress. Stars denote significant Sidak’s MC test between groups per test day, see Figure S3C. (I) Percent correct trials in reversal learning paradigm. “B” indicates Baseline Day, “R” indicates Reversal phase day. 3-way ANOVA, Test Day x Virus. Stars denote significant Sidak’s MC test between groups per test day, see Figure S3F. (J) RRHO comparing gene expression overlaps, where each pixel color represents the hypergeometric test overlap between differential transcriptomes. (K) Clustering at 1,929 DE genes between ZBT-OE SSDS and GFP SSDS. (L) Volcano plot of Bulk RNA-seq DEGs. (M) GO analysis for up/downregulated bulk DEGs in ZBT-OE SSDS vs. GFP SSDS, and GFP SSDS vs. GFP control. (N) Clustering at 715 DEGs between ZBT-OE SSDS vs. GFP SSDS astrocytes (n = 4/group). (O) Volcano plot depicting astrocyte DEGs (FDR < 0.1). (P) Clustering at 1,191 DEGs between ZBT-OE SSDS vs. GFP SSDS neurons (n = 4/group). (Q) Volcano plot depicting neuron DEGs (FDR < 0.1). (R) GO analysis for up/downregulated DEGs (FDR < 0.1) in astrocytes and neurons between ZBT-OE SSDS vs. GFP SSDS. All data graphed as means ± SEM. Data analyzed with 2-way or 3-way ANOVA with Sidak’s multiple comparisons test: ∗∗∗∗p < 0.0001, ∗∗∗p < 0.001, ∗∗p < 0.01, ∗p < 0.05; ns, not significant. Full statistics information is provided in the Supplemental Table S7_stats.
Fig. 4.
Fig. 4.. Astrocyte-specific ZBTB7A overexpression disrupts OFC neuronal activity patterns in response to mild stress.
(A) Schematic of experimental timeline with subthreshold stress paradigm performed after AAV6 injection into OFC, followed by slice electrophysiological recordings. (B) Input-output (I-O) curve of fEPSPs in response to stimuli. 3-way ANOVA, Interaction of Stimulus Intensity x Virus x Stress. (C) Individual values for (I-O) curve, area under curve (A.U.C). (D) fEPSP Paired-pulse ratio (PPR) 3-way ANOVA, Interaction of Stress x Virus. (E) Individual values for PPR at 50ms. (F) Percent change in fEPSP amplitude from baseline during 10Hz Stimuli train. 3-way ANOVA, Stimulus x Virus, Stress x virus. (G) Individual values for fEPSP recovery from rundown measured 1s after the simulation train. (H) Lens placement and IHC validation of hsyn-gCAMP8f (green, neurons) and GFAP-ZBT OE (red, astrocytes) in OFC Layer 5. (I) Example cell set and calcium traces. (J) Difference in standardized deltaF/F for neurons Pre- vs. Post-SSDS. (K) Right: Percentage of OFC neurons upmodulated by entry into social interaction zone with aggressor mouse. Left: Fraction of neurons significantly modulated by social interaction, stratified by modulation type for ZBT-OE SSDS vs. RFP SSDS. (L) Activity traces for example SI upmodulated neurons in ZBT-OE subject post-SSDS. (M) Mean activity of modulated neurons while [Right] mouse was outside the social interaction zone and [Left] while mouse was inside the social interaction zone. (N) IHC validation of AAV-hsyn-hM4D(Gi)-mCherry (in red, neurons) and GFAP-ZBT OE (in green, astrocytes) with GFAP (yellow) and DAPI (blue), and experimental scheme of chemogenetics experiment, in which SSDS is performed on a cohort of mice expressing hM4D(Gi)-mCherry (+/−) ZBT OE, (+/−) DCZ. (O) Social interaction with chemogenetic inhibition. All data graphed as means ± SEM. Data analyzed with 2-way or 3-way ANOVA with Sidak’s multiple comparisons test: ∗∗∗∗p < 0.0001, ∗∗∗p < 0.001, ∗∗p < 0.01, ∗p < 0.05; ns, not significant. Full statistics information is provided in the Supplemental Table S7_stats.
Fig. 5.
Fig. 5.. Knockdown of Zbtb7a in mouse OFC astrocytes reverses molecular, synaptic, and behavioral signatures of chronic stress.
(A) CSDS paradigm performed after AAV-GFAP-ZBT-KD-GFP vs. negative miR-GFP control injection into OFC, with example IHC viral expression. (B) RRHO comparing gene expression overlaps in bulk OFC tissue. (C) Clustering of groups at 1,583 DEG (FDR < 0.1) for GFP stress vs. GFP control in bulk OFC. (D) GO analysis for genes rescued by Zbt-KD stress vs. GFP-stress. (E) RRHO comparing gene expression overlaps in MACS-isolated astrocytes. (F) Clustering at 2,673 DEGs (FDR < 0.1) between GFP stress vs. GFP control in MACS-isolated astrocytes. (G) Venn-diagram and odds ratio tests of the overlap between DEGs in astrocytes between Zbt-KD stress vs. GFP stress and GFP stress vs. GFP control. (H) GO analysis for up/downregulated DEGs in GFP-stress vs. GFP control and Zbt-KD stress vs. GFP-stress. (I) RRHO comparing gene expression overlaps in neurons. (J) Clustering of groups at 2,540 DEGs (FDR < 0.1) between GFP stress vs. GFP control in neurons. (K) Venn-diagram and odds ratio test of the overlap between DEGs in neurons between Zbt-KD stress vs. GFP stress, and GFP stress vs. GFP control. (L) GO analysis for up/downregulated DEGs in GFP-stress vs. GFP control and Zbt-KD stress vs. GFP-stress. (M) Patch clamp electrophysiology recording scheme. (N-O) Resting membrane potential and depolarization-evoked spiking for control and stress groups. (P) Social interaction. (Q) Sucrose Preference Test. (R) Right: Associative Learning task. “D” = Day of task. 3-Way ANOVA, main effect of Test Day x Stress. Left: Individual values for Day two of task shown on right. (S) Right: Instrumental reward learning task on FR1 schedule. 3-Way ANOVA, main effect of Virus x Stress]. Left: Individual values for Day four of task shown on right. All data graphed as means ± SEM. Data analyzed with 2-way or 3-way ANOVA with Sidak’s multiple comparisons test: ∗∗∗∗p < 0.0001, ∗∗∗p < 0.001, ∗∗p < 0.01, ∗p < 0.05; ns, not significant. Full statistics information is provided in the Supplemental Table S7_stats.

References

    1. Kessler RC, Berglund P, Demler O, Jin R, Koretz D, Merikangas KR, Rush AJ, Walters EE, and Wang PS (2003). The epidemiology of major depressive disorder: results from the National Comorbidity Survey Replication (NCS-R). Jama 289, 3095–3105. - PubMed
    1. Rolls ET (2019). The orbitofrontal cortex and emotion in health and disease, including depression. Neuropsychologia 128, 14–43. - PubMed
    1. Treadway MT, Bossaller NA, Shelton RC, and Zald DH (2012). Effort-based decision-making in major depressive disorder: a translational model of motivational anhedonia. Journal of abnormal psychology 121, 553. - PMC - PubMed
    1. Cléry-Melin M-L, Schmidt L, Lafargue G, Baup N, Fossati P, and Pessiglione M (2011). Why don’t you try harder? An investigation of effort production in major depression. PloS one 6, e23178. - PMC - PubMed
    1. Sherdell L, Waugh CE, and Gotlib IH (2012). Anticipatory pleasure predicts motivation for reward in major depression. Journal of abnormal psychology 121, 51. - PMC - PubMed

LinkOut - more resources