. 2025 Jun 12;301(8):110369.
doi: 10.1016/j.jbc.2025.110369. Online ahead of print.

Regulation of steady state ribosomal transcription in Mycobacterium tuberculosis: Intersection of sigma subunits, superhelicity, and transcription factors

Affiliations

Regulation of steady state ribosomal transcription in Mycobacterium tuberculosis: Intersection of sigma subunits, superhelicity, and transcription factors

Ana Ruiz Manzano et al. J Biol Chem. .

Abstract

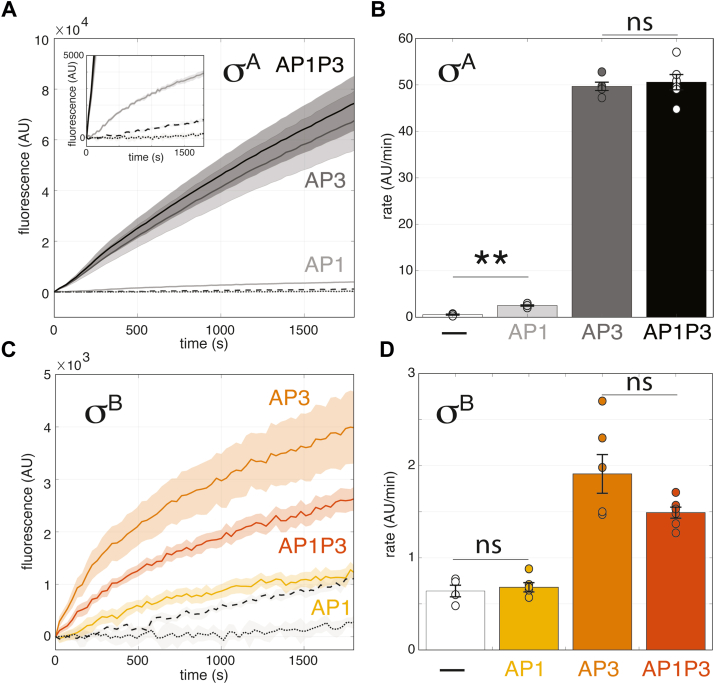
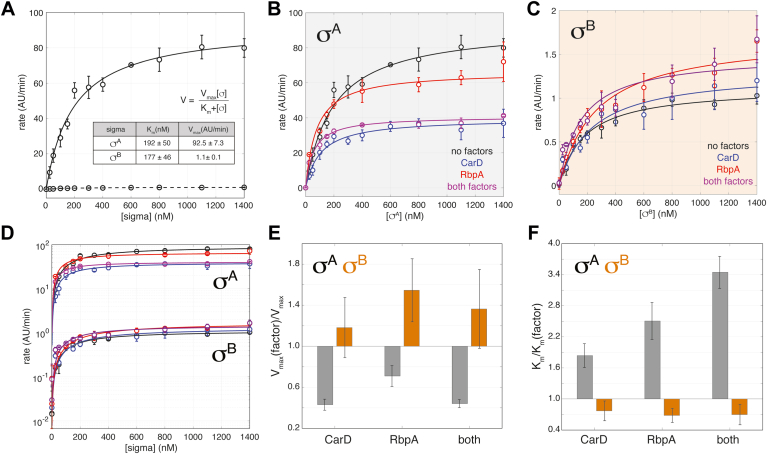
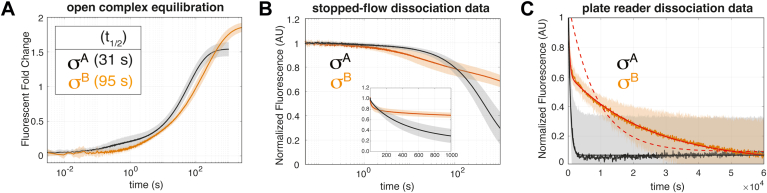
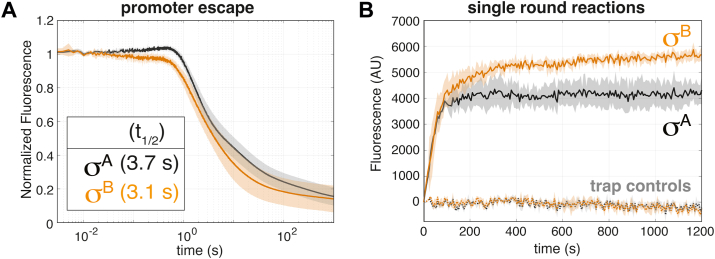
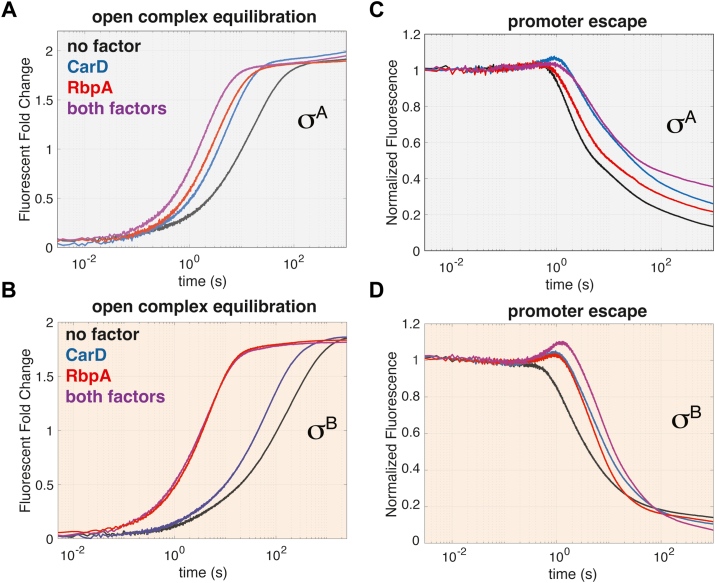
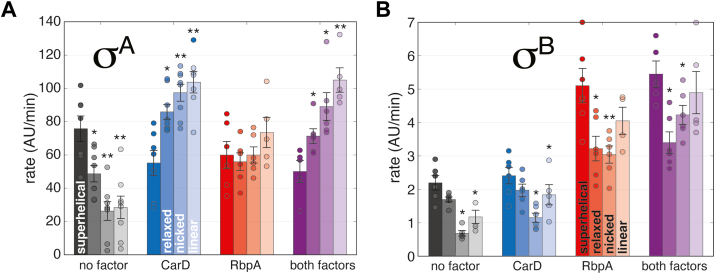
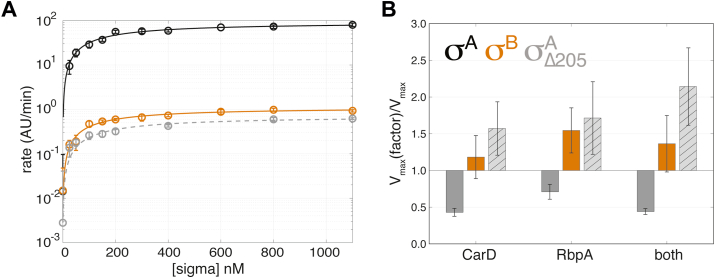
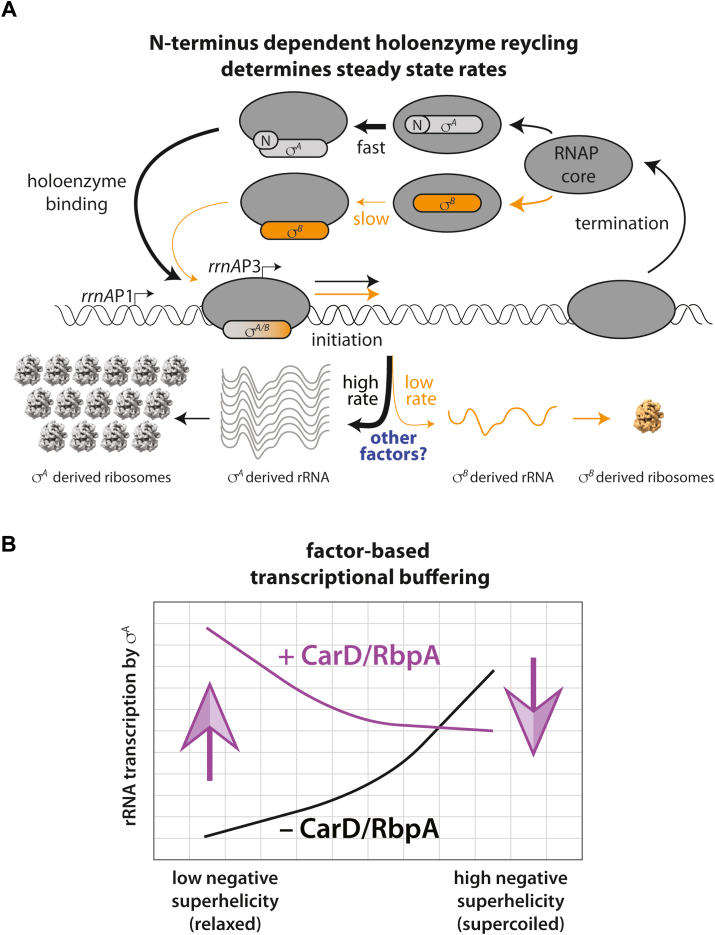
rRNA regulation in Mycobacterium tuberculosis (Mtb) is tightly linked to nutrient availability, growth phase, and global gene expression, influencing Mtb's adaptability and pathogenicity. Unlike most bacteria, Mtb has a single ribosomal operon with two promoters, rrnAP3 and rrnAP1, and a high ratio of sigma (σ) factors to genome size. While σA is the primary driver of ribosomal transcription, σB has been suggested to contribute under various conditions, though its role remains unclear. Here, we quantify steady-state transcription rates in reconstituted reactions and demonstrate that σA-driven transcription from rrnAP3 dominates rRNA production, with minimal contributions from σB or rrnAP1. Kinetic analysis suggests that σB holoenzymes exhibit slower DNA unwinding and holoenzyme recycling. We also show that transcription factors CarD and RbpA reverse and buffer, respectively, the stimulatory effects of negative superhelicity on σA-driven rRNA transcription. Finally, we identify the N-terminal 205 amino acids of σA as a key determinant of its increased activity relative to σB. Our findings reveal the intricate interplay of promoter sequence, σ factor identity, DNA superhelicity, and transcription factors in shaping transcription initiation kinetics to ultimately influence rRNA production in Mtb.

Keywords: CarD; DNA topology; Mycobacterium tuberculosis; RNA polymerase; RbpA; bacterial transcription; gene regulation; kinetics; rRNA; sigma factors; steady state; superhelicity; transcription factors.


Conflict of interest statement

Conflict of interest The authors declare that they have no conflicts of interest with the contents of this article.

Figures

Figure 1
Figure 1
Quantification of steady-state rates from rrnAP1, rrnAP3, rrnAP1P3, and promoterless using σA (top) and σB (bottom) holoenzymes. A and C, comparison of real-time fluorescent signal time courses of RNA synthesis. Template without promoter is shown with a black line. Signal from rrnAP3 with core RNAP (i.e., no σ factor) is depicted with a dotted line. Shaded areas indicate the SEM of five experiments. B and D, quantification of steady-state rates using linear fits between 500 and 1800 s. Template without promoter is shown in gray. Individual data points from five independent replicates are plotted (each one performed in three technical replicates). Error bars represent SEMs. p values (paired t test) are indicated as follows: not significant (−) and less than 0.05 (∗). rrnAP3 containing templates are significant over no promoter with p values of 8 × 10⁻⁷ and 2 × 10⁻³ for σA and σB holoenzymes, respectively. RNAP, RNA polymerase.
Figure 2
Figure 2
Modulation of steady-state transcription by CarD and RbpA. A, steady-state transcription rates as a function of σ factor concentration fit to a hyperbolic curve (σAsolid line and σBdotted line). Table insert shows the fit parameters. B, titration of σA with no factors (black), CarD (blue), RbpA (red), and both factors (purple). C, titration of σB with no factors (black), CarD (blue), RbpA (red), and both factors (purple). D, a comparison of the titrations in (B) and (C) on a logarithmic scale. Error bars represent SEM for each measurement and solid lines represent fits to a hyperbolic curve. E, the ratio of Vmaxs in the presence/absence of factors for σA (gray) and σB (orange) holoenzymes calculated from the data in (B) and (C) is plotted for each factor individually and combined. Ratios greater than one indicate an increase in the Vmax in the presence of factors. F, the ratio of Kms in the absence/presence of factors for σA (gray) and σB (orange) holoenzymes calculated from the data in (B) and (C) are plotted for each factor individually and combined. Ratios greater than one indicate a decrease in the Km in the presence of factors.
Figure 3
Figure 3
Open complex formation and decay kinetics for σA and σB holoenzymes on the rrnAP3 promoter: In all panels, σA (black) and σB (orange) holoenzymes are shown. Shaded regions represent the SDs from multiple experiments. A, fluorescent fold-change over background as a function of time showing the approach to open complex equilibrium after the addition of holoenzyme via stopped-flow. B, open complex decay measured via stopped-flow showing the early phases of dissociation. C, open complex decay measured via plate-reader showing the longer timescale phase unique to σB holoenzyme. Solid lines indicate fits to σA (single exponential) and σB (double exponential), while a single-exponential fit to σB (dotted line) is shown for comparison.
Figure 4
Figure 4
Promoter escape and single-round kinetics for σA and σB holoenzymes on the rrnAP3 promoter. In all panels, σA (black) and σB (orange) holoenzymes are shown. Shaded regions represent the SDs from multiple experiments. A, normalized fluorescence as a function of time showing the decay upon mixing preformed open complexes with DNA competitor and rNTPs via stopped-flow. B, fluorescent signal as a function of time for single-round aptamer assays in the presence of DNA competitor. Both σA (black) and σB (orange) traces were well fit by a single exponential. Controls where DNA competitor was added prior to mixing with NTPs (dotted lines) confirm single-round conditions.
Figure 5
Figure 5
Dependence of forward and dissociation/escape kinetics on CarD and RbpA for σA and σB holoenzymes on the rrnAP3 promoter. In all panels, no factor (black) traces were collected under conditions where open complex was saturated and are compared to those in the presence of CarD (blue), RbpA (red), and both factors together (purple). A and B, open complex equilibration kinetics for σA and σB holoenzymes, respectively. C and D, promoter escape kinetics for σA and σB holoenzymes, respectively. Note that the increase in fluorescence starting at ∼100 ms before the fluorescence decay reports on initial transcribing intermediates (see (30)) and is not discussed here further. These traces represent averages from three independent shots.
Figure 6
Figure 6
DNA topology dependence ofrrnAP3steady-statetranscription and its modulation by transcription factors. Results are shown for σA (A) and σB (B) holoenzymes. Factor conditions are indicated on the x-axis and topology is indicated by different bar shades from superhelical (dark) to linear (light) for each factor condition. Individual data points in each condition are plotted (each one the average of three technical replicates). Error bars indicate the SEM. p values (paired t test) comparing different topologies to the superhelical template in each factor category are indicated by asterisks as follows: less than 0.05 (∗), less than 0.005 (∗∗), and less than 0.0005 (∗∗∗).
Figure 7
Figure 7
The effect of the N-terminal extension of σA. A, steady-state transcription rates as a function of σ factor concentration for σA (black), σB (orange), and σAΔ205 (dashed gray line). Error bars represent SEM and lines represent fits to hyperbolic curves. B, the ratio of Vmaxs in the presence/absence of factors for σA (gray), σB (orange), and σAΔ205 (light gray with hatchmarks) holoenzymes calculated from the data in (A) is plotted for each factor individually and combined.
Figure 8
Figure 8
Models of rRNA regulation in mycobacteria. A, differences in the kinetics of holoenzyme recycling may explain the differences in σ factor transcriptional activity. B, CarD and RbpA buffer the production of rRNA against changes in DNA topology.

Update of

Similar articles

References

    1. Global Tuberculosis Programme (GTB) World Health Organization; Geneva: 2024. WHO Global tuberculosis report 2024.
    1. Gengenbacher M., Kaufmann S.H.E. Mycobacterium tuberculosis: success through dormancy. FEMS. Microbiol. Rev. 2012;36:514–532. - PMC - PubMed
    1. Rodrigue S., Provvedi R., Jacques P.É., Gaudreau L., Manganelli R. The sigma factors of Mycobacterium tuberculosis. FEMS. Microbiol. Rev. 2006;30:926–941. - PubMed
    1. Flentie K., Garner A.L., Stallings C.L. Mycobacterium tuberculosis transcription machinery: ready to respond to host attacks. J. Bacteriol. 2016;198:1360–1373. - PMC - PubMed
    1. Balázsi G., Heath A.P., Shi L., Gennaro M.L. The temporal response of the Mycobacterium tuberculosis gene regulatory network during growth arrest. Mol. Syst. Biol. 2008;4:225. - PMC - PubMed

LinkOut - more resources