. 2025 Jun 14;8(1):361.
doi: 10.1038/s41746-025-01761-5.

Large scale causal modeling to identify adults at risk for combined and common variable immunodeficiencies

Affiliations

Large scale causal modeling to identify adults at risk for combined and common variable immunodeficiencies

Giorgos Papanastasiou et al. NPJ Digit Med. .

Abstract

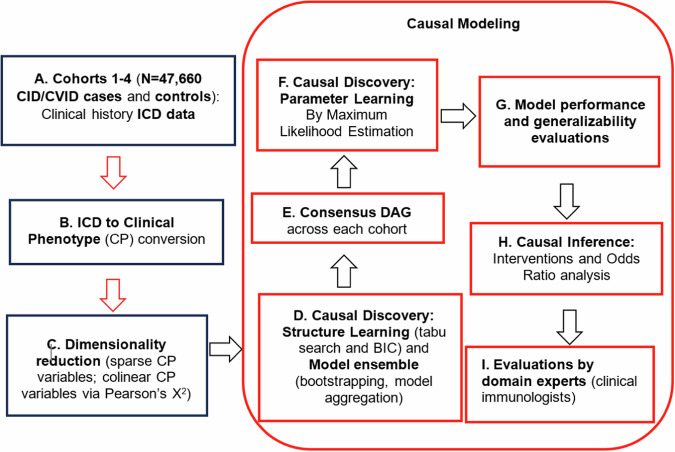
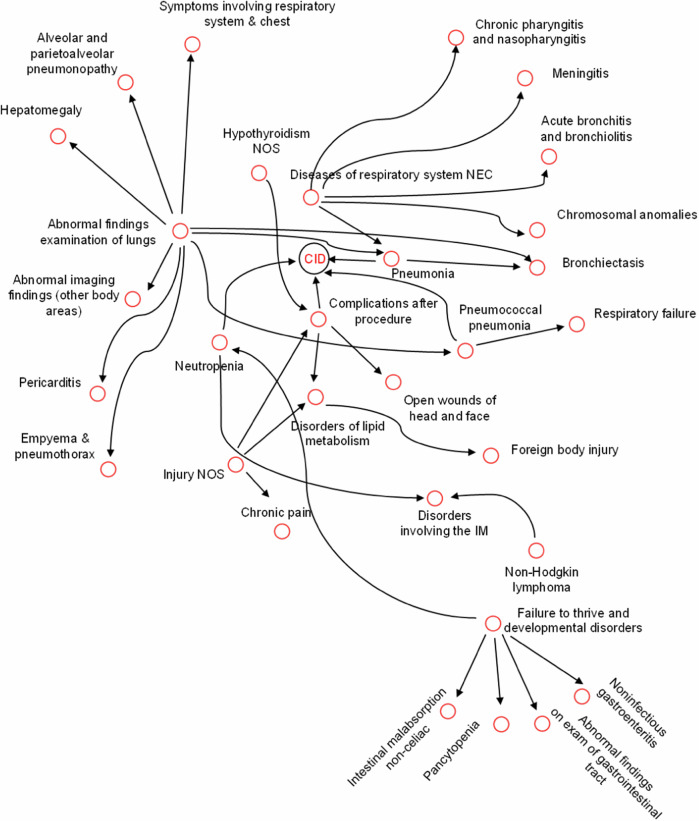
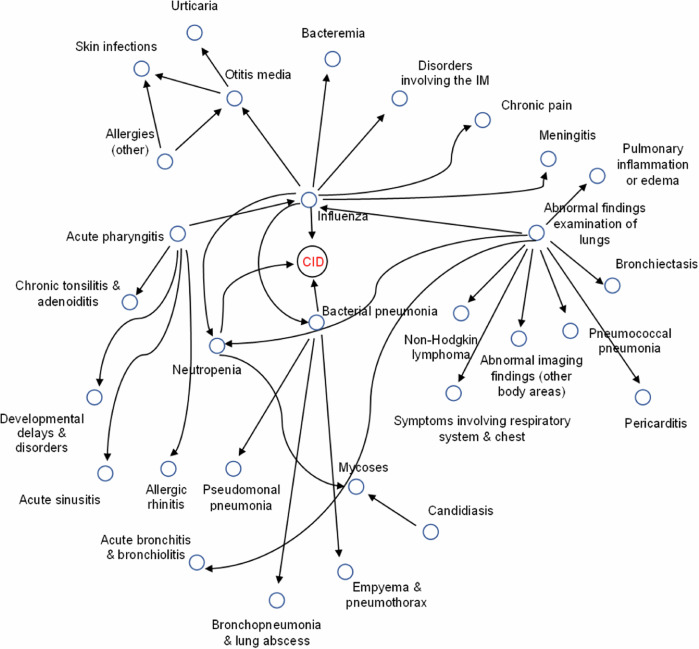
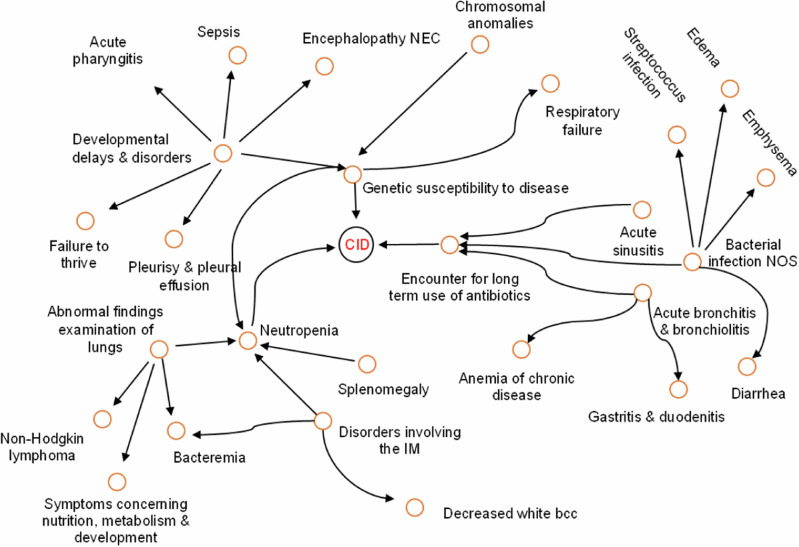
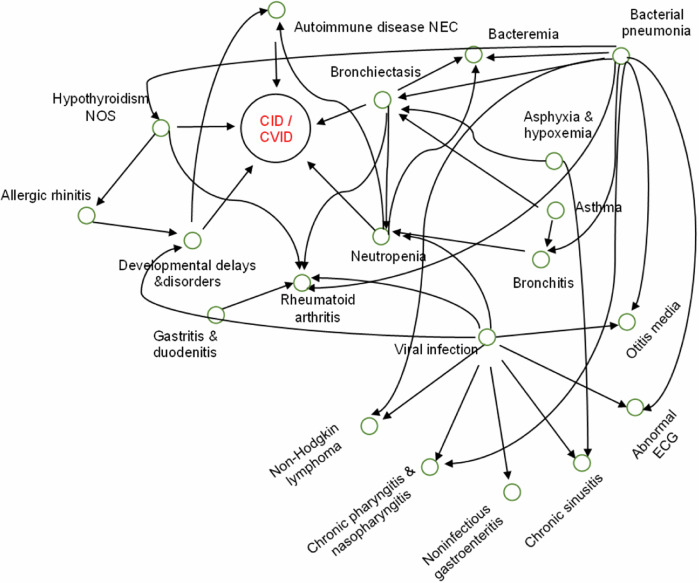
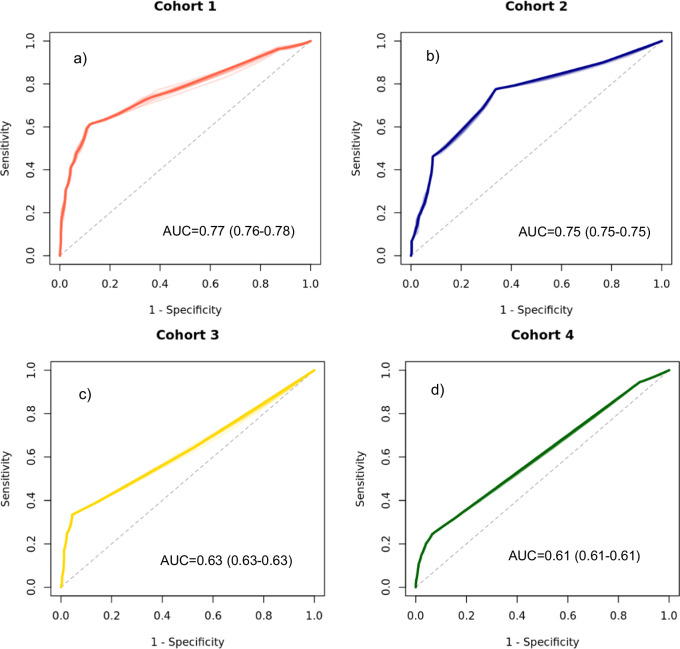
Combined immunodeficiencies (CID) and common variable immunodeficiencies (CVID), prevalent yet substantially underdiagnosed primary immunodeficiencies, necessitate improved early detection. Leveraging large-scale electronic health records (EHR) from four nationwide US cohorts, we developed a novel causal Bayesian Network (BN) model to identify antecedent clinical phenotypes associated with CID/CVID. Consensus directed acyclic graphs (DAGs) demonstrated robust predictive performance within each cohort (ROC AUC: 0.61-0.77) and generalizability across unseen cohorts (ROC AUC: 0.56-0.72) in identifying CID/CVID, despite varying inclusion criteria across cohorts. The consensus DAGs reveal causal relationships between comorbidities preceding CID/CVID diagnosis, including autoimmune and blood disorders, lymphomas, organ damage or inflammation, respiratory conditions, genetic anomalies, recurrent infections, and allergies. Further evaluation through causal inference and by expert clinical immunologists substantiates the clinical relevance of the identified phenotypic trajectories. These findings hold promise for translation into improved clinical practice, potentially leading to earlier identification and intervention of adults at risk for CID/CVID.


Conflict of interest statement

Competing interests: G.P., K.B., N.V.V. and V.I. are full-time employees of Pfizer and hold stock/stock options. The other authors do not have any financial or non-financial competing interests to declare.

Figures

Fig. 1
Fig. 1. Study workflow.
Overview of the causal modeling framework. The process encompasses data extraction and pre-processing (blue), including cohort selection, ICD code to clinical phenotype conversion and dimensionality reduction. Causal modeling (red) includes structure learning and model ensemble, consensus DAG estimation, parameter learning, model performance and generalizability assessment, causal inference and evaluation by clinical immunologists. CID: Combined Immunodeficiency, CVID: Common Variable Immunodeficiency, BIC: Bayesian Information criterion, DAGs: directed acyclic graphs.
Fig. 2
Fig. 2. Consensus DAG calculated in Cohort 1.
Cohort 1 included N = 797 CID cases with pneumonia and 797 matched controls (with no PI) with pneumonia. To improve clarity, we visualize up to 2 direct parent levels and up to 2 direct child levels away from CID diagnosis. To provide further context, up to 1 direct parent level for each direct child and up to 1 direct child level for each direct parent are included. DAG directed acyclic graph; NEC not elsewhere classified; NOS not otherwise specified; IM immune mechanism; CID combined immunodeficiency; PI primary immunodeficiency.
Fig. 3
Fig. 3. Consensus DAG calculated in Cohort 2.
Cohort 2 included N = 797 CID cases with pneumonia and 797 matched controls (with no PI) with and without pneumonia. We visualize up to 2 direct parent levels and up to 2 direct child levels away from CID diagnosis. Up to 1 direct parent level for each direct child and up to 1 direct child level for each direct parent are included. DAG directed acyclic graph; IM immune mechanism; CID combined immunodeficiency; PI primary immunodeficiency.
Fig. 4
Fig. 4. Consensus DAG calculated in Cohort 3.
Cohort 3 included N = 2,312 CID cases (of which 797 with pneumonia) and 2312 matched controls (with no PI), both with and without pneumonia. We visualize up to 2 direct parent levels and up to 2 direct child levels away from CID diagnosis. Up to 1 direct parent level for each direct child and up to 1 direct child level for each direct parent are included. DAG directed acyclic graph; NEC not elsewhere classified; NOS not otherwise specified; IM immune mechanism; bcc blood cell count; CID combined immunodeficiency; PI primary immunodeficiency.
Fig. 5
Fig. 5. Consensus DAG calculated in Cohort 4.
Cohort 4 included N = 19,924 CID and CVID cases (of which 2350 with pneumonia) and 19,924 matched controls (with no PI), both with and without pneumonia. We visualize up to 2 direct parent levels and up to 2 direct child levels away from CID diagnosis. Up to 1 direct parent level for each direct child and up to 1 direct child level for each direct parent are included. DAG directed acyclic graph; NEC not elsewhere classified; NOS not otherwise specified; IM immune mechanism; ECG electrocardiogram; CID combined immunodeficiency; CVID common variable immunodeficiency; PI primary immunodeficiency.
Fig. 6
Fig. 6. Receiver operating characteristic curves (ROC).
ROC for all causal models developed (in the training set) and evaluated (test set) across all four cohorts. Here, ROC analysis demonstrates the evaluations performed in the held-out test set, within each cohort (e.g., a DAG trained and tested in Cohort 1, a DAG trained and tested in Cohort 2, and so forth). a CID patients with pneumonia against pneumonia patients without PI (N = 1594; 797 CID cases and 797 controls). b CID patients with pneumonia against randomly selected patients without PI, with and without pneumonia (N = 1594; 797 CID cases and 797 controls). c CID patients with and without pneumonia against randomly selected patients without PI, with and without pneumonia (N = 4624; 2312 CID cases and 2,312 controls). d All CID and CVID patients with and without pneumonia against randomly selected patients without PI, with and without pneumonia (N = 39,848; 19,924 PI cases and 19,924 controls). Across all cohorts, PI cases and controls were 1:1 matched for age, gender, race, ethnicity, duration of medical history, and the number of healthcare visits. CID combined immunodeficiency; CVID common variable immunodeficiency.

Similar articles

References

    1. McCusker, C., Upton, J. & Warrington, R. Primary immunodeficiency. Allergy Asthma Clin. Immunol.14, 61 (2018). - PMC - PubMed
    1. Pinto, M. V. & Neves, J. F. Precision medicine: The use of tailored therapy in primary immunodeficiencies. Front Immunol.13, 1029560 (2022). - PMC - PubMed
    1. Sole, D. Primary immunodeficiencies: a diagnostic challenge?. J. Pediatr.97, S1–S2 (2021). - PMC - PubMed
    1. Bousfiha, A. et al. The 2022 Update of IUIS Phenotypical Classification for Human Inborn Errors of Immunity. J. Clin. Immunol.42, 1508–1520 (2022). - PubMed
    1. Tangye, S. G. et al. Human inborn errors of immunity: 2019 update on the classification from the International Union of Immunological Societies expert committee. J. Clin. Immunol.40, 24–64 (2020). - PMC - PubMed

LinkOut - more resources