. 2025 Jun 15;10(1):191.
doi: 10.1038/s41392-025-02272-1.

Purine nucleoside phosphorylase dominates Influenza A virus replication and host hyperinflammation through purine salvage

Affiliations

Purine nucleoside phosphorylase dominates Influenza A virus replication and host hyperinflammation through purine salvage

Yang Yue et al. Signal Transduct Target Ther. .

Abstract

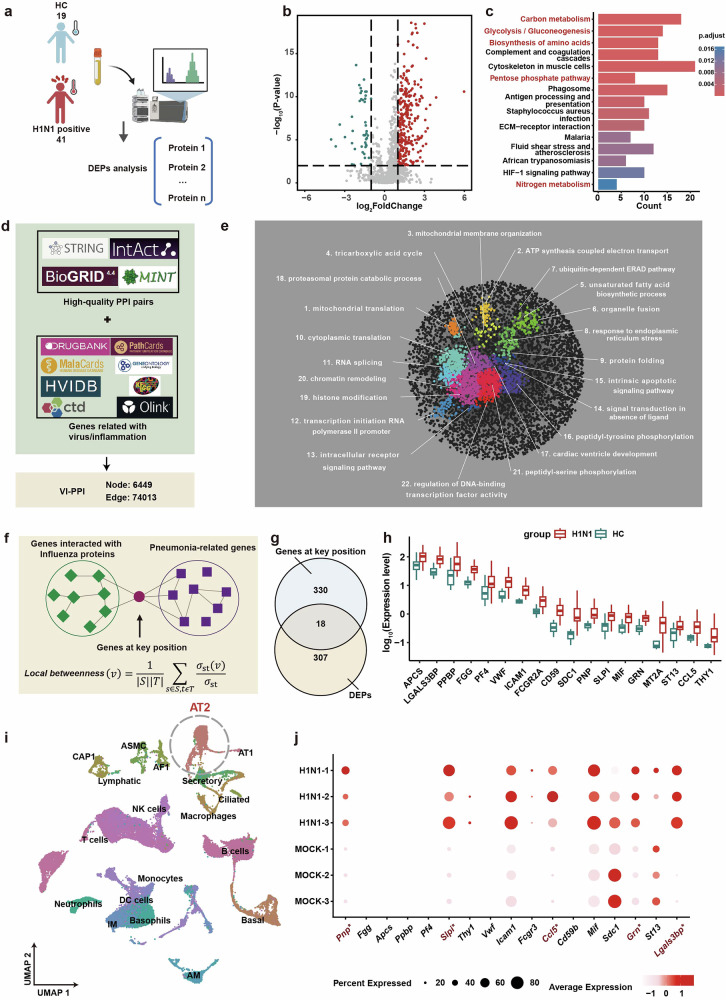
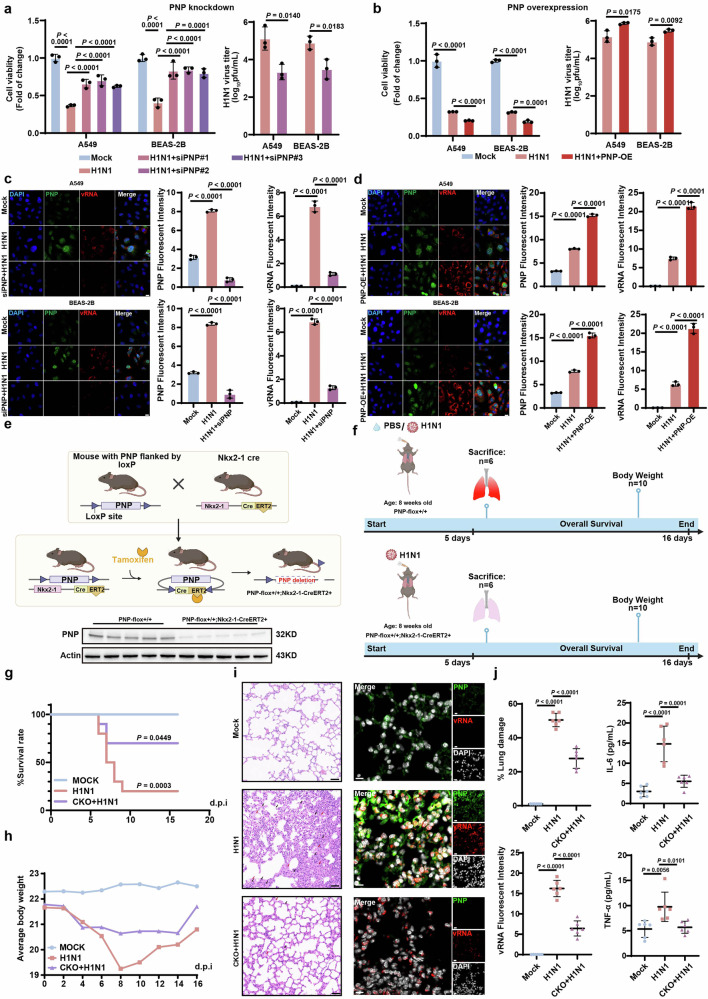
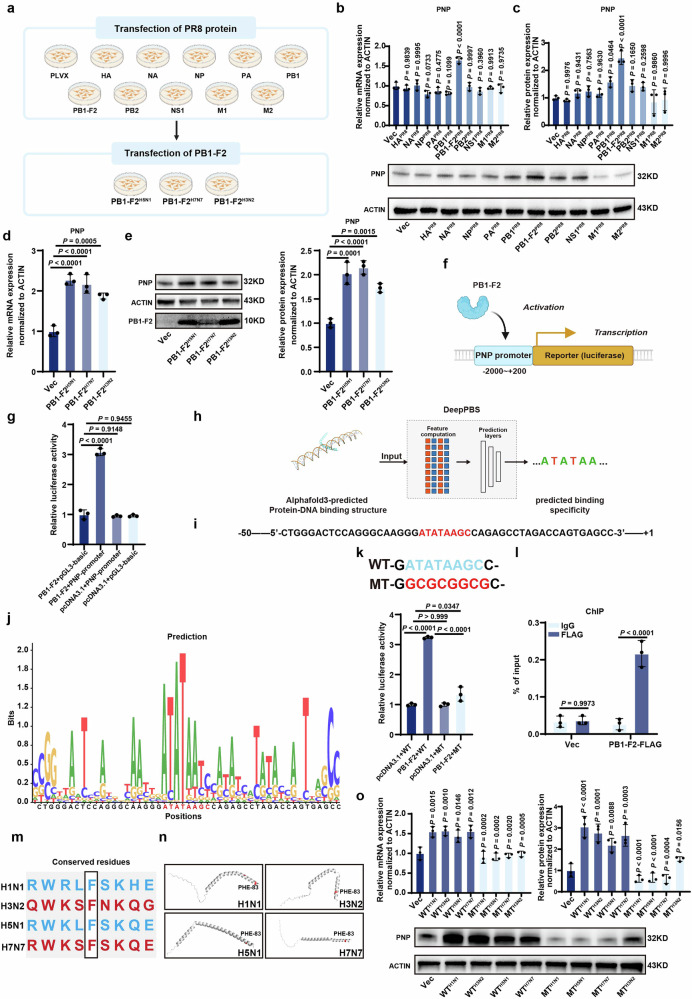
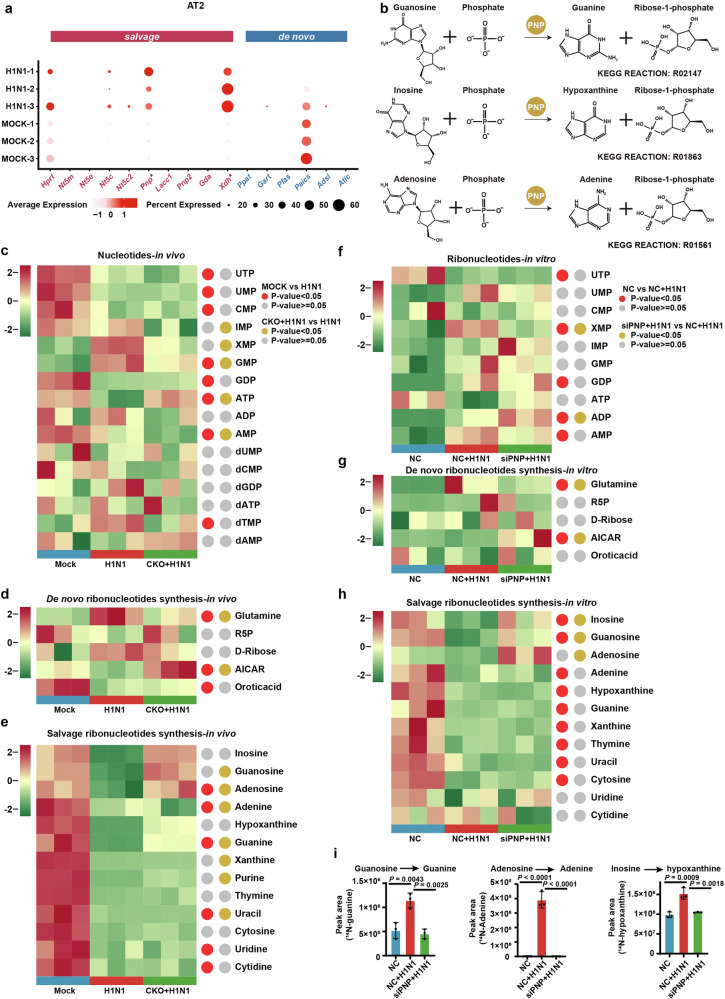
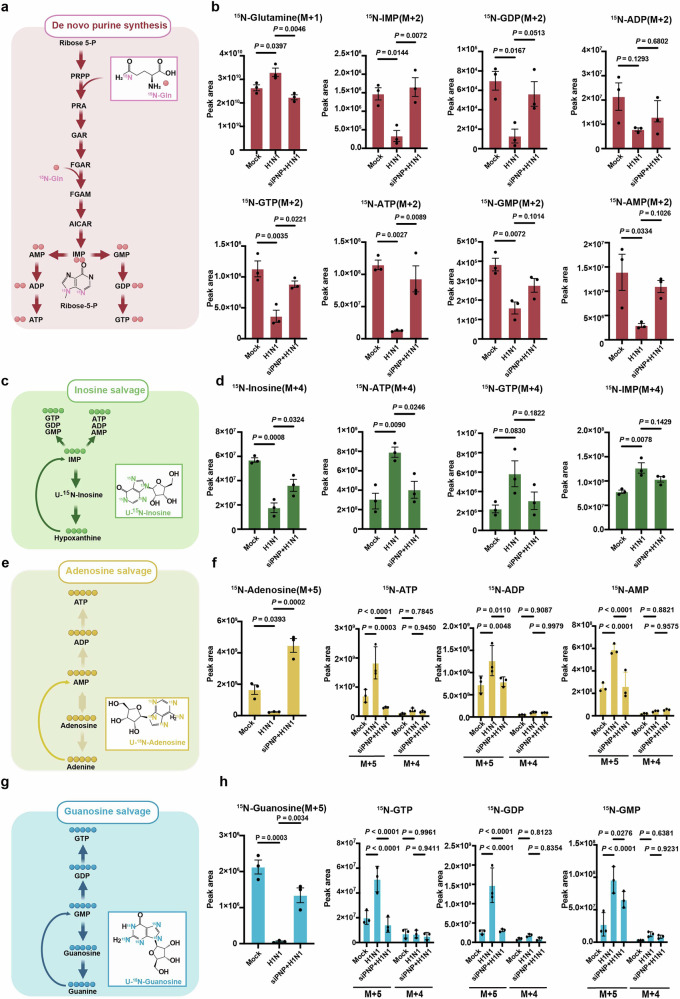
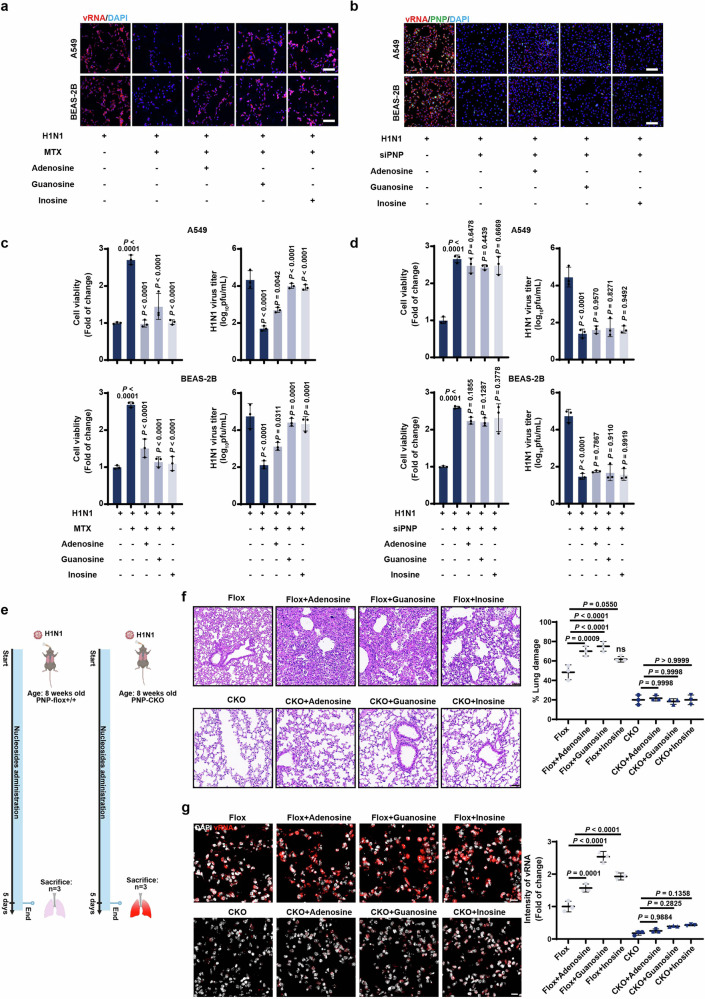
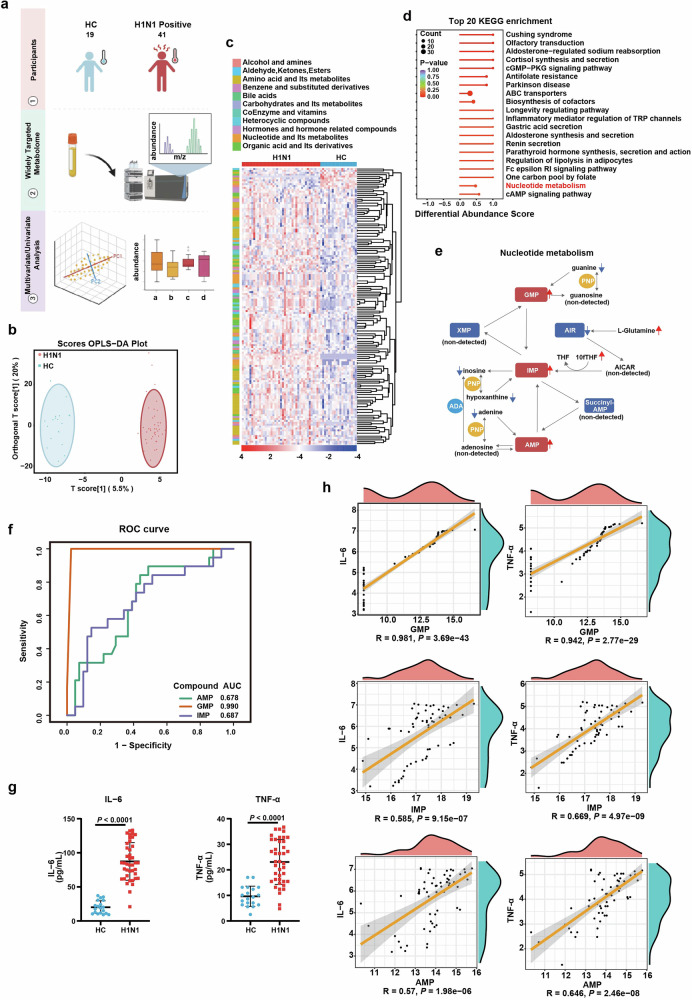
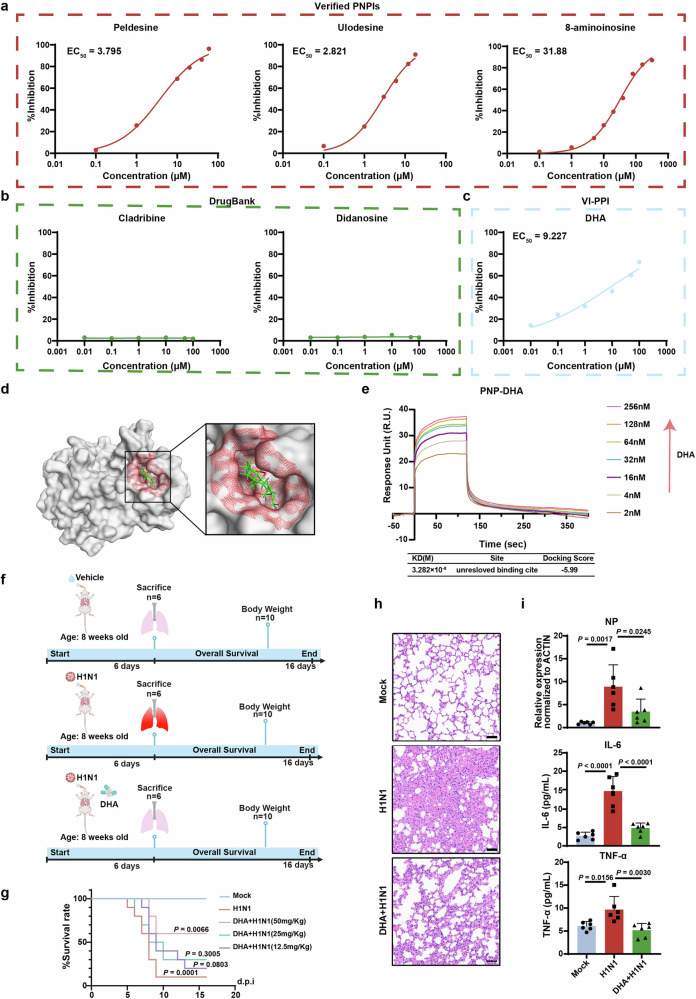
Influenza A virus (IAV) poses a significant threat to human health. The outcome of IAV results from the viral-host interaction, with the underlying molecular mechanisms largely unknown. By integrating the plasma proteomics data of the IAV-infected patients into the viral-inflammation protein-protein interaction (VI-PPI) network created in this study, purine nucleoside phosphorylase (PNP), the critical enzyme in purine salvage, was identified as a potential hub gene that connected the different stages of IAV infection. Extended survival rates and reduced pulmonary inflammatory lesions were observed in alveolar epithelial cell (AEC)-specific PNP conditional knockout mice upon H1N1 infection. Mechanistically, PB1-F2 of IAV was revealed as a novel viral transcriptional factor to bind to the TATA box of PNP promoter, leading to enhanced purine salvage in H1N1-challenged AECs. The activation of PNP-mediated purine salvage was verified in IAV-infected patients and A549 cells. PNP knockdown elicited a purine metabolic shift from augmented salvage pathway to de novo synthesis, constraining both viral infection and pro-inflammatory signaling through APRT-AICAR-AMPK activation. Moreover, durdihydroartemisinin (DHA), predicted by VI-PPI as a novel PNP inhibitor, exerted beneficial effects on the survival and weight gain of H1N1-challenged mice via its direct binding to PNP. To reveal for the first time, we found that PNP, activated by IAV, plays a hub role within H1N1-host interaction, simultaneously modulating viral replication and hyperinflammation through purine salvage. Our study sheds new light on a "two-for-one" strategy by targeting purine salvage in combating IAV-related pathology, suggesting PNP as a potential novel anti-influenza host target.


Conflict of interest statement

Competing interests: The authors declare no competing interests.

Figures

Fig. 1
Fig. 1
PNP was identified as a potential hub gene in IAV infection via VI-PPI network. a Overview of the workflow for the proteomic analysis of the plasma derived from H1N1-infected patients and healthy controls. The peripheral plasma of 19 healthy controls and 41 H1N1-infected patients were collected, followed by proteomics analysis. b The volcano map of the plasma proteomic data. The differentially expressed proteins (DEPs) were labeled as blue (downregulation) and red (upregulation). P < 0.05, fold change > 1.5 or <0.6667. c The KEGG pathway enrichment analysis of DEGs between the healthy and H1N1-infected individuals. The top 15 KEGG pathways enriched by DEGs (H1N1-infected vs. Healthy controls) were displayed. d Data collection for VI-PPI. VI-PPI network was constructed on the basis of protein-protein interaction, containing molecules related to viral infection, host inflammation, and drug targets, with 6449 nodes (genes) and 74103 edges (PPI pairs). e The landscape of VI-PPI. A total of 22 functional domains were enriched and marked with different colors by SAFE tools in Cytoscape. Each cluster was annotated with the most relevant gene ontology (GO) term. f The algorithm for the identification of the key hub genes during influenza progression. Hub genes by VI-PPI network, defined as genes that were significantly located at the shortest paths from H1N1-related genes to pneumonia-related genes, were extracted by calculating the local betweenness centrality (the upper panel). g The Venn plot of shared hub genes among infection of different strains of influenza virus by VI-PPI. 348 hub genes with potential broad-spectrum among the 4 strains of influenza virus (H1N1, H7N7, H5N1, H3N2, Supplementary Fig. 1e) by VI-PPI prediction were used to overlap with a total of 325 differentially expressed proteins (DEPs) derived from the plasma proteome of clinical cohort (H1N1 infected vs. healthy control). 18 overlapped genes were identified by Venn plot. h The overview of the expression of the overlapping genes by the plasma proteomic data of the clinical cohort. The expression of the 18 overlapping DEPs based on the proteomic data of H1N1-infected vs. healthy control was shown by box plot. i, j The ScRNA-seq analysis of lungs derived from the control and H1N1 mice models. The scRNA-seq data of H1N1-infected mice were obtained from previously published data (https://ngdc.cncb.ac.cngsabrowse/CRA013573). t-SNE plot revealed 19 clusters, and the expression of the 18 overlapping DEPs in alveolar type 2 (AT2) cells was analyzed. Differentially expressed genes (DEGs) with significance were labeled as red. All data are presented as mean ± SD; unless otherwise indicated, N = 3 biologically independent experiments; Statistical analysis was performed by two-tailed Student’s t-test (h) and Wilcoxon rank-sum test (j). *P < 0.01 versus Mock (j)
Fig. 2
Fig. 2
PNP knock down/knock out in alveolar epithelial cells (AEC) exhibit anti-influenza capacity in vitro/in vivo. The effect of PNP inhibition (a) or PNP overexpression (b) on cell viability and virus titer upon 24 h post H1N1 infection. A549 or BEAS-2B cells were transfected with NC/PNP siRNA at 30 pmol (a) or 2 µg control vector/PNP-overexpression vector (b) before challenged with H1N1 (MOI = 5). Cell viability and viral titer of H1N1-infected A549 cells and BEAS-2B cells with or without PNP knockdown/overexpression were evaluated at 24 h post-infection. FISH and IF analysis of vRNA and PNP expression in alveolar epithelial cells with or without PNP knockdown/overexpression upon H1N1. Both A549 and BEAS-2B cells were transfected by NC/PNP siRNA (c) or control vector/PNP-overexpression vector (d), followed by FISH of H1N1 viral genomic RNA (vRNA) and IF assay of PNP, respectively. DAPI was used to stain nuclei of the cells (Scale bar: 20 μm). e Schematic representation of the generation of AEC-specific PNP conditional knockout mice models. PNP expression in the lung tissue of PNPflox/flox and Nkx2-1-CreERT2, PNPflox/flox mice was analyzed by Western blot. f Diagram of the experimental procedures. Briefly, 8-week-old PNPflox/flox mice and PNP conditional knockout mice were intranasally challenged with 2LD50 (h) or 4LD50 (g) H1N1. The survival rate and body weight change upon IAV infection. The survival rate (g) and body weight change (h) of the different groups (n = 10) were observed daily for a course of 16 days. The inflammation lesion and viral infection within the lungs. After 6 days of infection, 6 mice from each group were sacrificed, with the lungs dissociated and subjected to H&E staining (N = 6, Scale bar: 50μm, (i), FISH of vRNA and IF assay of PNP. DAPI was used to indicate nucleus (N = 6, Scale bar: 10 μm, i). The area of lung damage and intensity of vRNA were shown. The concentration of TNF-ɑ and IL-6 levels in mice plasma (N = 6) was measured by ELISA on day 6 post infection (j). All data are presented as mean ± SD; unless otherwise indicated, N = 3 biologically independent experiments; Statistical analysis was performed by one-way ANOVA (c, d, j), two-tailed Student’s t test (a, b) and Log-rank test (g)
Fig. 3
Fig. 3
IAV PB1-F2 transcriptionally activated PNP expression by binding to the TATA-box of the promoter. a Schematics of the establishment of A549 cells stably transfected by various of H1N1 proteins and the transient transfection of PB1-F2-overexpressing vectors to A549 cells. A549 cells stably overexpressed different H1N1 proteins were used to screen H1N1 protein most relevant to PNP expression. Moreover, PB1-F2-overexpressing vectors of other strains of IAV (H5N1, H7N7, H3N2) were transiently transfected into A549 cells to analyze their effect on PNP expression. The relative expression of PNP in A549 cells stably expressed different H1N1 proteins. The mRNA (b) and protein (c) level of PNP were quantified by qRT-PCR and Western blot, respectively. The effect of PB1-F2 proteins of other IAV strains ((H5N1, H7N7 and H3N2)) on PNP expression. A549 cells were transiently transfected with vectors overexpressing PB1-F2 of other strains of IAV for 24 h, followed by examining the mRNA (d) and protein (e) level of PNP via qRT-PCR and Western Blot analysis, respectively. f, g Effect of PB1-F2 on the luciferase activity of PNP-promoter reporter gene by the dual luciferase assay. The PB1-F2-overexpressing plasmid was co-transfected with pGL3-PNP-promoter reporter gene and Renilla luciferase reporter in 293 T cells for 24 h. Renilla luciferase activities were used as an internal reference. The assay was performed in triplicate. The values are expressed as mean ± SD. h Diagram of motif prediction based on Alphafold 3 and DeepPBS. The exact binding site of PB1-F2 on PNP promoter was predicted by combining Alphafold 3 and DeepPBS analysis. i Schematics of the −50 ~ + 1 sequence of PNP promoter. The TATA-box was shown in red. j Predicted PB1-F2-binding motif on PNP promoter within the −50 ~ + 1 sequence. The PB1-F2-binding consensus sequence is shown in red. k Dual luciferase assay of the wild type or TATA-box-mutated PNP luciferase reporter plasmid upon PB1-F2 overexpression. The PNP luciferase reporter plasmid containing the predicted motif (50 bp) with or without the mutated TATA-box were co-transfected with PB1-F2-expressing plasmid and Renilla luciferase reporter into 293T cells for 24 h. Renilla luciferase activities were used as an internal reference. The assay was performed in triplicate. The values are expressed as mean ± SD. l The binding of PB1-F2 to the TATA-box in PNP promoters was examined by ChIP-qPCR. 293T cells were transfected by PB1-F2-Flag overexpression plasmid and luciferase reporter gene for PNP promoter, followed by anti-Flag antibody pulldown (IgG was used as negative control) and subsequent ChIP-qPCR analysis. ChIP-qPCR was conducted using primers flanking TATA-box in PNP promoters. The occupancy of PB1-F2 on the binding site was calculated as percentage of respective input DNA concentration. m Conserved phenylalanine residues among different strains of IAV. Phe-83 was identified to be conserved within PB1-F2 protein across H1N1, H3N2, H5N1, and H7N7 viruses. n The structure of PB1-F2 of different strains of viruses was predicted using AlphaFold 3. The phenylalanine residue was highlighted in red. o F83Y-mutated PB1-F2 overexpression plasmids of different strains of viruses failed to upregulate PNP expression. A549 cells were transiently transfected with vectors overexpressing either wild-type or mutated PB1-F2 proteins of various strains of IAV for 24 h, followed by examination of the mRNA and protein level of PNP via qRT-PCR and Western Blot analysis, respectively. All data are presented as mean ± SD; unless otherwise indicated, N = 3 biologically independent experiments; Statistical analysis was performed by one-way ANOVA (be, g, k, o), two-way ANOVA (l)
Fig. 4
Fig. 4
Compromised PNP activity suppresses H1N1-hijacked host purine nucleotide salvage. a (ScRNA-seq analysis of lungs derived from control and H1N1 mice models. The expression of enzymes involved in both purine de novo and salvage biosynthesis in alveolar type 2 (AT2) cells. b Schematic of PNP-catalized purine salvage pathway. ce LC-MS-based targeted metabolomics analysis of AEC-specific PNP conditional knockout mice after challenged for 6 days. Heat map showing the pulmonary metabolites landscape of nucleotides biosynthesis (c), dedes synthesis (d), and salvage pathway (e) based on metabolomic data. The experiments are performed in 3 replicates. Metabolites with P < 0.05 were defined as biologically significant. N = 3. fh LC-MS-based targeted metabolomics analysis of A549 cells with or without PNP knockdown after challenged for 24 h. A549 cells, transfected by 30 pmol NC or PNP siRNA for 12 h, were challenged with H1N1 at an MOI of 5 for another 24 h, followed by metabolomic analysis. Heat map showing the intracellular metabolites landscape of ribonucleotides biosynthesis (f), de novo ribonucleotides synthesis (g), and salvage pathway (h) based on metabolomic data. The experiments are performed in three replicates. Metabolites with P < 0.05 were defined as biologically significant. i PNP convert purine nucleosides to purines upon H1N1 infection. A549 cells were treated with [U-15N] guanosine, [U-15N] adenosine and [U-15N] inosine for 4 h, respectively. Intracellular 15N-Guanine, 15N-adenine and 15N-hypoxanthine were measured with LC-MS. All data are presented as mean ± SD; unless otherwise indicated, N = 3 biologically independent experiments; Statistical analysis was performed by two-tailed Student’s t-test (a) and one-way ANOVA (c-i). *P < 0.01 versus Mock (a)
Fig. 5
Fig. 5
PNP knockdown re-routes metabolic flux from purine salvage to de novo synthesis upon IAV infection. a, c, e, g Schematic of metabolic flux assay for purine synthesis. The de novo purine synthesis was tracked by isotype-labeled [Amide-15N] glutamine (a), inosine salvage by [U-15N] inosine (c), adenosine salvage by [U-15N] adenosine (e), and guanosine salvage by [U-15N] guanosine (g). b, d, f, h Metabolic flux analysis of metabolites involved in de novo purine synthesis and purine salvage pathways. The control and H1N1 infected A549 cells were cultured in media containing 15N-labeled starting material for 4 h before mass spectrometry analysis of isotype-labeled glutamine (b), inosine (d), adenosine (f), and guanosine (h), as well as related purine nucleosides. The experiment was conducted in triplicate. M + (n): the gross (n) of incorporated 15N. All data are presented as mean ± SD; unless otherwise indicated, N = 3 biologically independent experiments; Statistical analysis was performed by one-way ANOVA (b, d), f (15N-Adenosine) and h (15N-Guanosine); Two-way ANOVA in f (15N-ATP, 15N-ADP and 15N-AMP) and h (15N-GTP, 15N-GDP and 15N-GMP)
Fig. 6
Fig. 6
PNP-mediated purine salvage is essential for H1N1 propagation. a, c The effect of nucleosides on viral replication and cell viability upon MTX treatment in challenged cells. H1N1-challenged A549 and BEAS-2B cells were cultured in medium with 2 μM MTX for 12 h, and then treated by adenosine (50 μM), guanosine (50 μM), or inosine (50 μM) for another 24 h, followed by FISH analysis of vRNA (Scale bar: 100 μm, a). Cell viability and viral titer were also examined (c). b, d The effect of nucleosides on viral replication and cell viability was dependent on PNP activity. H1N1-infected A549 and BEAS-2B cells, transfected by NC siRNA or PNP siRNA, were cultured in the addition of 50 μM guanosine, inosine, or adenosine for 24 h. FISH analysis of vRNA, IF assay of PNP, and DAPI staining were performed (Scale bar: 100 μm, (b). Cell viability and viral titer were also analyzed (d). All the experiments were conducted in triplicates. e Diagram of the experimental procedures. Briefly, 8-week-old PNPflox/flox mice and PNP conditional knockout mice were intranasally challenged with 2LD50 H1N1. H1N1-infected mice were intragastric administered with adenosine (8 mg/Kg), guanosine (8 mg/Kg), and inosine (8 mg/Kg), respectively. f, g The inflammatory lesion and viral infection within the lungs of H1N1-infected mice. After 6 days of infection, 3 mice from each group were sacrificed, with the lungs dissociated and subjected to H&E staining (f, Scale bar: 50 μm), FISH of vRNA, and IF assay of PNP (g). DAPI was used to indicate nucleus (N = 6, Scale bar: 10 μm). The area of lung damage and intensity of vRNA (f, g, the right plots) were shown. All data are presented as mean ± SD; unless otherwise indicated, N = 3 biologically independent experiments; Statistical analysis was performed by one-way ANOVA (c, d, f, g)
Fig. 7
Fig. 7
Purine nucleotides in the blood of IAV-infected patients is correlated with infection and peripheral inflammation. a The schematic diagram of widely-targeted metabolomic profiling of plasma from H1N1 patients (H1N1 positive) and healthy control (HC). Briefly, the plasma of the peripheral blood from 19 HC and 41 H1N1 patients were subjected to widely-targeted metabolomic analysis. b Orthogonal partial least square discriminant analysis (OPLS-DA) for the data from widely targeted metabolomic profiling of HC and H1N1 positive individuals. The HC and H1N1 group were discriminated into two separated clusters by OPLS-DA analysis. c Heatmap of identified metabolites. The expression of 657 identified metabolites from the widely-targeted metabolomic data were represented by heatmap. d KEGG pathway enrichment analysis of the differentiated expressed metabolites between HC and infected individuals. The top 20 KEGG pathways were enriched, with the annotation of nucleotide metabolism pathway being labeled as red. e An overview of purine metabolism pathway alterations and metabolites involved in de novo purine synthesis and purine salvage. Red arrows indicated upregulated metabolites, while blue arrows indicated downregulated ones. f AUC-ROC curve analysis of the correlation between purine nucleotide and H1N1 infection. The discriminative capability of purine nucleotide GMP, IMP, and AMP in distinguishing H1N1-infected and uninfected individuals was quantified by area under ROC curve (AUC), with GMP showing the highest AUC. g The expression of TNF-ɑ and IL-6 in the peripheral plasma. The concentration of TNF-ɑ and IL-6 of the control and H1N1-infected patients were measured by ELISA. h The correlation analysis between inflammatory cytokines and purine nucleotides. The correlation of purine nucleotides (GMP, IMP, AMP) with inflammatory cytokines (TNF-ɑ, IL-6) in the peripheral blood of H1N1 patients. All data are presented as mean ± SD; Statistical analysis was performed by two-tailed Student’s t-test (g) and Spearman rank correlation coefficient (h)
Fig. 8
Fig. 8
VI-PPI-predicted dihydroartemisinin (DHA) plays an anti-influenza role in vitro/in vivo by targeting host PNP. a The anti-H1N1 activities of the verified PNPIs. MDCK cells infected with H1N1 at an MOI of 0.01 were treated with PNPIs (peldesine, ulodesine, ganciclovir) at different doses for 24 h, followed by analysis of the viral copy number in the supernatant of H1N1-infected cells. b The effect of DrugBank-predicted PNPIs on H1N1 replication. MDCK cells infected with H1N1 at an MOI of 0.01 were treated with cladribine or didanosine at different concentrations for 24 h, followed by analysis of the viral copy number in the supernatant of H1N1-infected cells. c The anti-H1N1 activity of VI-PPI-predicted PNPI. H1N1-infected MDCK cells were treated with different doses of DHA, which was predicted by VI-PPI network, and then the viral copy number in the supernatant was analyzed. d Molecular operating environment (MOE) analysis of the interaction between PNP and DHA. The potential binding sites in PNP are highlighted in red and DHA is indicated in green. e The kinetic profile of DHA-PNP binding reaction by surface plasmon resonance (SPR) assay. PNP was immobilized to the surface of the sensor chip. The binding and dissociation of DHA at different concentrations with PNP chip were monitored. The predicted docking score and affinity parameters of DHA binding to PNP are displayed in the lower chart. (f–i) The in vivo effect of DHA on H1N1 infection. f The schematic of the in vivo assay of the effect of DHA on H1N1-infected mice models. Briefly, mice were randomized into 3 groups (mock, H1N1 plus vehicle (90% corn oil and 10% DMSO), H1N1 plus DHA (12.5 mg/Kg, 25 mg/Kg, 50 mg/Kg)). Vehicle or DHA were intraperitoneally administered for 6 consecutive days. g The survival rate was monitored for 16 consecutive days after infection (N = 10). h The lung tissue of the mice was dissected for H&E analysis 6 days after vehicle or DHA treatment (N = 6, Scale bar: 50 μm). i Expression level of nuclear protein (NP) of H1N1 in mice lung (N = 6) measured by qRT-PCR on day 6 post infection. The concentration of TNF-ɑ and IL-6 levels in mice plasma (N = 6) was measured by ELISA on day 6 post infection. All data are presented as mean ± SD; unless otherwise indicated, N = 3 biologically independent experiments; Statistical analysis was performed by Log-rank test (g) and one-way ANOVA (i)

Similar articles

References

    1. Gautam, A. et al. Necroptosis blockade prevents lung injury in severe influenza. Nature628, 835–843 (2024). - PMC - PubMed
    1. Gu, C. et al. A human isolate of bovine H5N1 is transmissible and lethal in animal models. Nature636, 711–718 (2024). - PubMed
    1. Uyeki, T. M. et al. Highly pathogenic avian influenza A(H5N1) virus infection in a dairy farm worker. N. Engl. J. Med.390, 2028–2029 (2024). - PubMed
    1. Gupta, N. & Silke, J. Blocking cell death limits lung damage and inflammation from influenza. Nature628, 726–727 (2024). - PubMed
    1. Leung, R. C. et al. Global emergence of neuraminidase inhibitor-resistant influenza A(H1N1)pdm09 viruses with I223V and S247N mutations: implications for antiviral resistance monitoring. Lancet Microbe5, 627–628 (2024). - PubMed

MeSH terms