

Phthalates unleashed: decoding ovarian carcinogenesis through multi-omics networks, single-cell insights, and molecular docking
- PMID: 40517225
- PMCID: PMC12166584
- DOI: 10.1186/s13048-025-01710-6
Phthalates unleashed: decoding ovarian carcinogenesis through multi-omics networks, single-cell insights, and molecular docking
Abstract
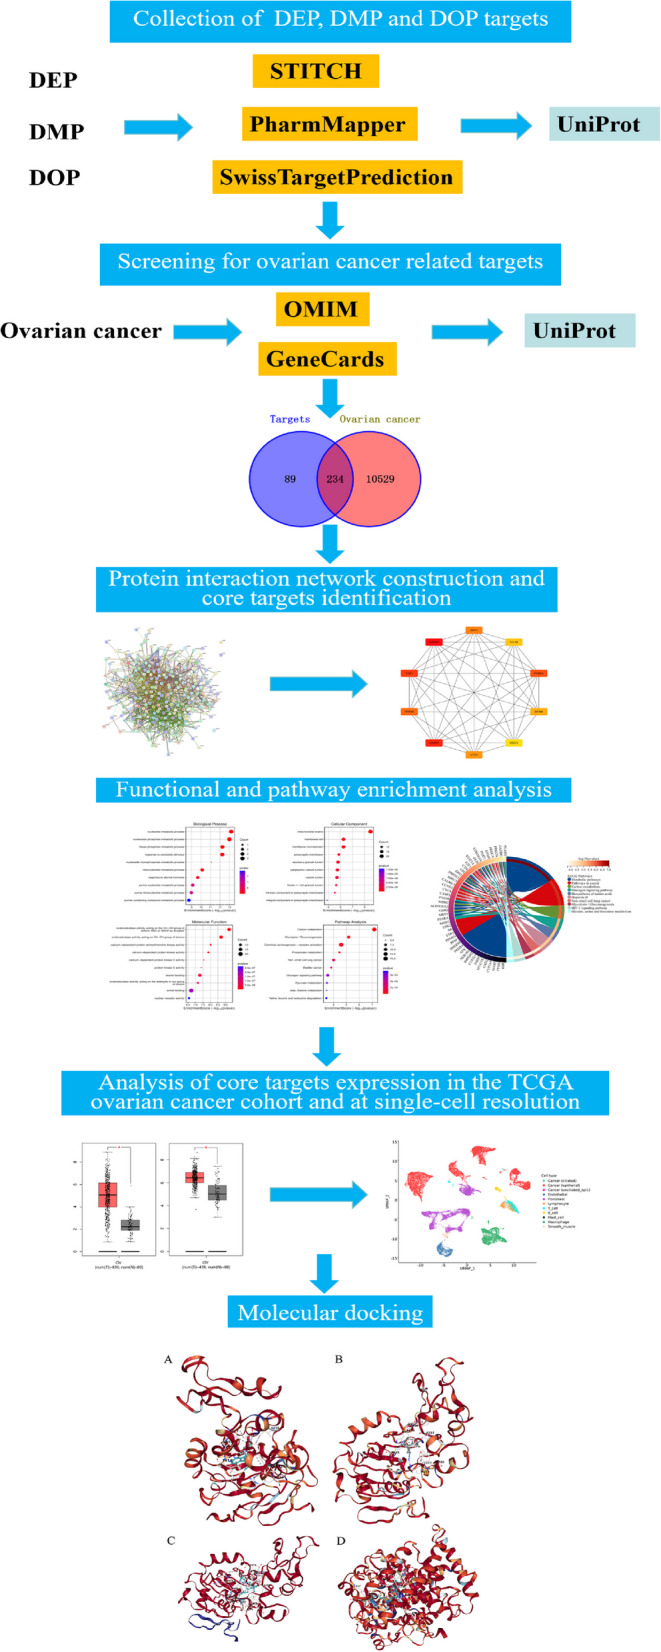
Background: Despite epidemiological studies linking phthalates to ovarian cancer, their multi-target molecular mechanisms remain unresolved, hindering biomarker discovery and preventive strategies. This study integrates network toxicology, multi-omics analyses, and molecular docking to systematically delineate phthalate-driven oncogenic pathways, thereby bridging mechanistic gaps and informing targeted interventions.
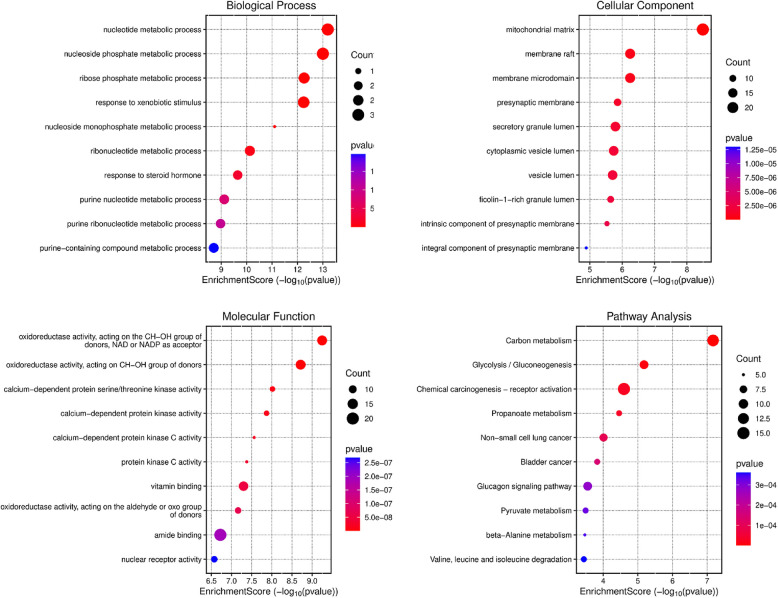
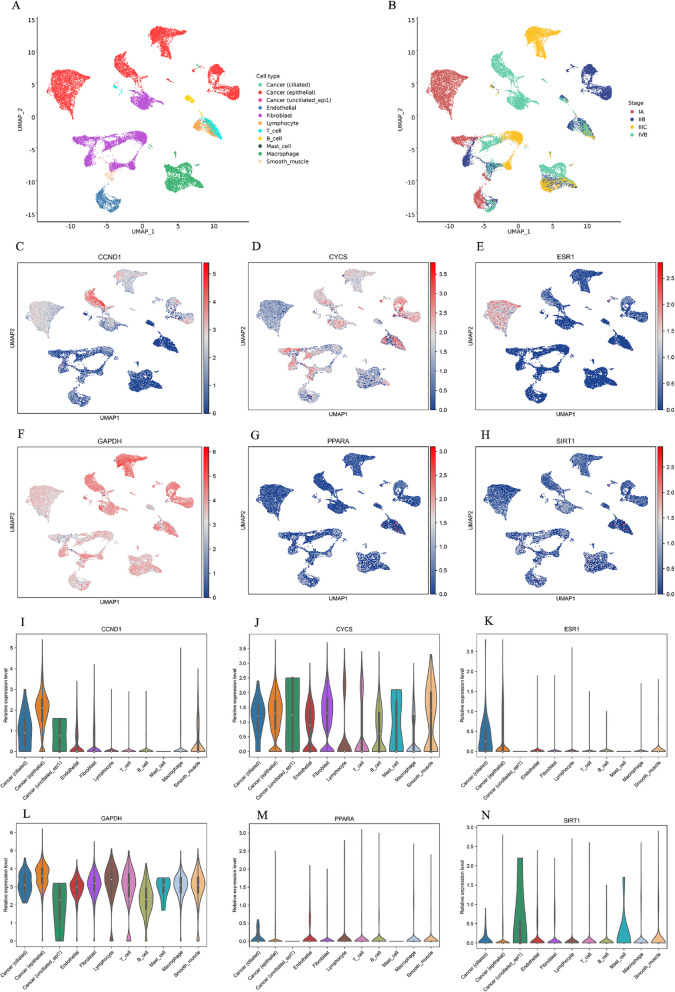
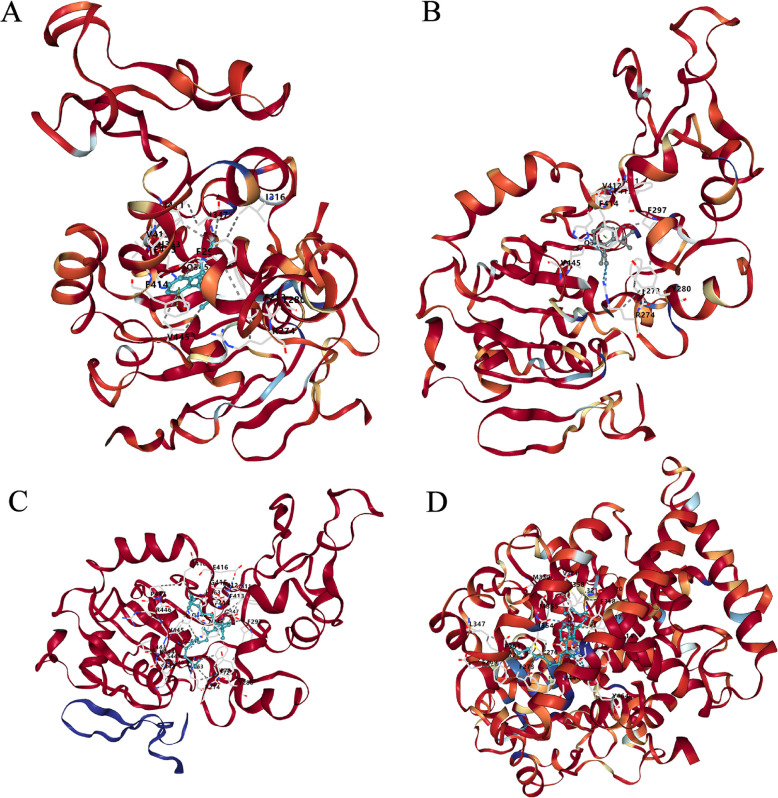
Results: We identified 234 potential targets related to phthalate exposure and ovarian cancer. Enrichment analysis revealed that these genes are associated with HIF-1 signaling, and metabolic pathways that promote cancer progression. Seven core genes were identified, with six (GAPDH, CASP3, PPARG, ESR1, CYCS, SIRT1, and CCND1) exhibiting differential expression in the TCGA ovarian cancer cohort. Single-cell analysis confirmed their widespread expression across various cell types, underscoring their roles in tumor biology. Molecular docking revealed specific binding interactions between phthalates and six core proteins.
Conclusions: Integrated computational analyses indicate that phthalates (DEP, DMP, DOP) may drive ovarian carcinogenesis through metabolic reprogramming (HIF-1α/glycolysis), strong binding to SIRT1/PPARα regulators, and tumor microenvironment remodeling. These findings establish a framework for prioritizing environmental carcinogens and identifying exposure biomarkers, with implications for reevaluating phthalate safety and elucidating the SIRT1-HIF1-PPARα axis in cancer pathogenesis.
Keywords: Molecular docking; Network toxicology; Ovarian cancer; Phthalates; ScCancerExplorer.
© 2025. The Author(s).
Conflict of interest statement
Declarations. Ethics approval and consent to participate: Not applicable. Consent for publication: Not applicable. Competing interests: The authors declare no competing interests.
Figures


Similar articles
-
Elucidating the mechanism of plasticizers inducing breast cancer through network toxicology and molecular docking analysis.Ecotoxicol Environ Saf. 2024 Oct 1;284:116866. doi: 10.1016/j.ecoenv.2024.116866. Epub 2024 Aug 22. Ecotoxicol Environ Saf. 2024. PMID: 39178760
-
Decoding per- and polyfluoroalkyl substances (PFAS) in hepatocellular carcinoma: a multi-omics and computational toxicology approach.J Transl Med. 2025 May 2;23(1):504. doi: 10.1186/s12967-025-06517-z. J Transl Med. 2025. PMID: 40317014 Free PMC article.
-
Shared molecular mechanisms of bisphenol A and phthalates in endometriosis: A bioinformatics and molecular docking study.Ecotoxicol Environ Saf. 2025 Jul 1;299:118388. doi: 10.1016/j.ecoenv.2025.118388. Epub 2025 May 26. Ecotoxicol Environ Saf. 2025. PMID: 40424730
-
IMPACT OF REAL-LIFE ENVIRONMENTAL EXPOSURES ON REPRODUCTION: Phthalates disrupt female reproductive health: a call for enhanced investigation into mixtures.Reproduction. 2025 Jan 9;169(2):e240117. doi: 10.1530/REP-24-0117. Print 2025 Feb 1. Reproduction. 2025. PMID: 39555988 Free PMC article. Review.
-
Possible mechanism of phthalates-induced tumorigenesis.Kaohsiung J Med Sci. 2012 Jul;28(7 Suppl):S22-7. doi: 10.1016/j.kjms.2012.05.006. Epub 2012 Jul 10. Kaohsiung J Med Sci. 2012. PMID: 22871597 Free PMC article. Review.
References
-
- Zhang J, Bajari R, Andric D, Gerthoffert F, Lepsa A, Nahal-Bose H, Stein LD, Ferretti V. The international cancer genome consortium data portal. Nat Biotechnol. 2019;37(4):367–9. - PubMed
-
- Domingo-Almenara X, Siuzdak G. Metabolomics data processing using XCMS. Methods Mol Biol. 2020;2104:11–24. - PubMed
MeSH terms
Substances
Grants and funding
LinkOut - more resources
Full Text Sources
Medical
Research Materials
Miscellaneous
