

Identification of CWH43 as a novel prognostic biomarker and therapeutic target in clear cell renal cell carcinoma by a multi-omics approach and correlation with autophagy progression
- PMID: 40517334
- PMCID: PMC12167738
- DOI: 10.1007/s12672-025-02392-8
Identification of CWH43 as a novel prognostic biomarker and therapeutic target in clear cell renal cell carcinoma by a multi-omics approach and correlation with autophagy progression
Abstract
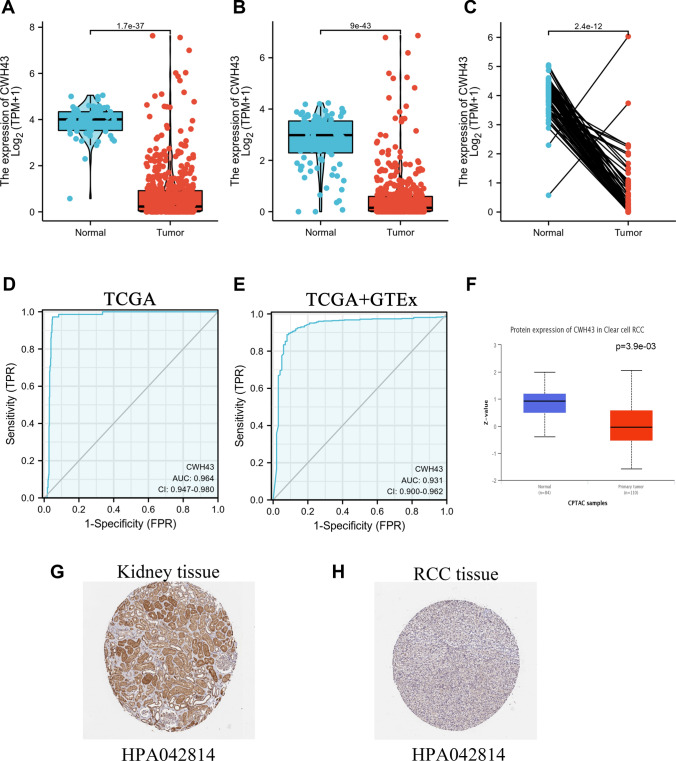
Background: Clear cell renal cell carcinoma (ccRCC) poses significant challenges due to its asymptomatic nature and poor prognosis at advanced stages. Identifying novel biomarkers is essential for enhancing prognostic accuracy and therapeutic strategies. This study explores the CWH43 gene, utilizing multi-omics data to determine its role in ccRCC.
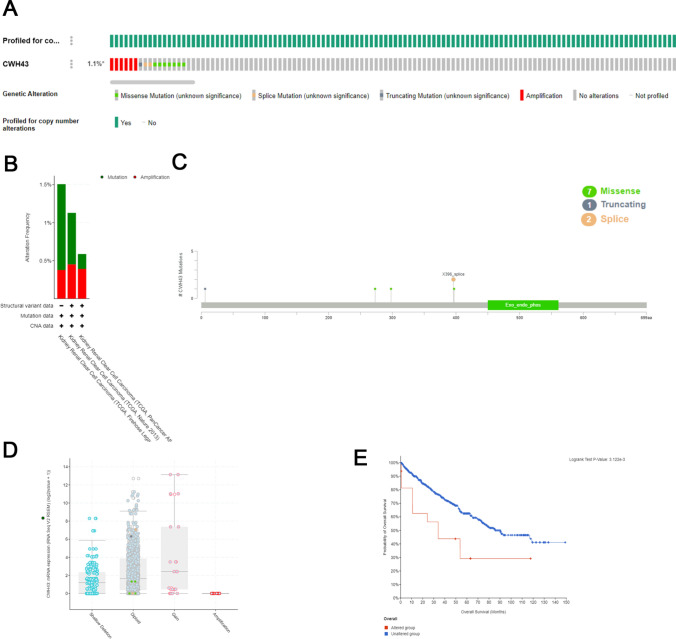
Methods: Genomic, transcriptomic, and methylation data from TCGA-KIRC and GEO databases were analyzed to evaluate CWH43 expression and clinical impact. Bioinformatics tools assessed correlations with patient outcomes and pathway involvement.
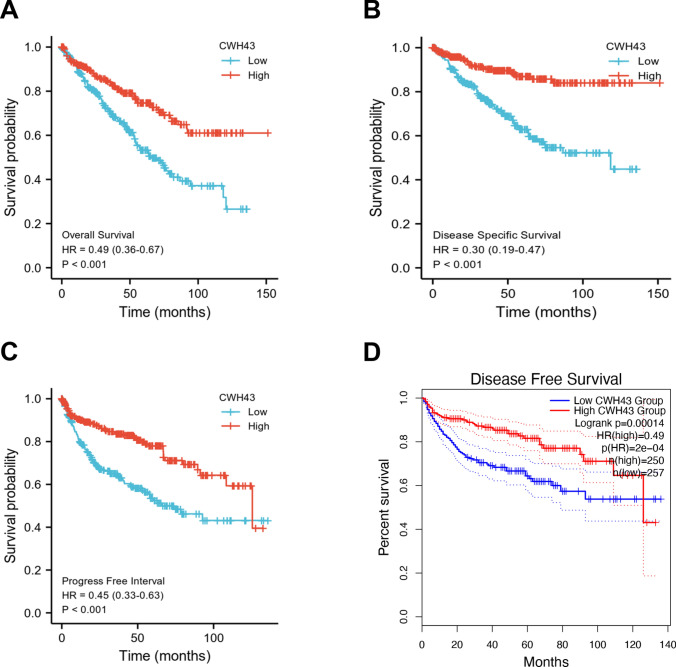
Results: CWH43 expression was significantly reduced in ccRCC tissues and correlated with advanced disease stages and poor patient survival. Enrichment analyses revealed CWH43's involvement in critical cancer pathways, such as autophagy and immune response modulation, suggesting its significant role in ccRCC pathophysiology. Lower CWH43 levels were associated with increased tumor progression and immune evasion, impacting the tumor microenvironment.
Conclusion: This study highlights the utility of multi-omics data in identifying CWH43 as a novel prognostic biomarker for ccRCC. Integrating CWH43 into clinical practice could refine prognostic assessments and guide personalized therapy strategies, aligning with advancements in modern oncology. Further research is warranted to explore CWH43's mechanisms and therapeutic potential.
Keywords: CWH43; Cancer immunology; CcRCC; Immunotherapy response biomarkers; Next-generation sequencing technologies; Therapeutic targets in immunotherapy; Tumor microenvironment; Tumor-immune interactions.
© 2025. The Author(s).
Conflict of interest statement
Declarations. Competing interests: The authors declare no competing interests.
Figures


Similar articles
-
Multi-omics profiles refine L-dopa decarboxylase (DDC) as a reliable biomarker for prognosis and immune microenvironment of clear cell renal cell carcinoma.Front Oncol. 2022 Dec 5;12:1079446. doi: 10.3389/fonc.2022.1079446. eCollection 2022. Front Oncol. 2022. PMID: 36544704 Free PMC article.
-
ITGB3 is a Novel Prognostic Biomarker and Correlates with Aberrant Methylation and Tumor Immunity in Clear Cell Renal Cell Carcinoma.Comb Chem High Throughput Screen. 2024 Aug 12. doi: 10.2174/0113862073311689240730112355. Online ahead of print. Comb Chem High Throughput Screen. 2024. PMID: 39136511
-
Integrative -omics and HLA-ligandomics analysis to identify novel drug targets for ccRCC immunotherapy.Genome Med. 2020 Mar 30;12(1):32. doi: 10.1186/s13073-020-00731-8. Genome Med. 2020. PMID: 32228647 Free PMC article.
-
Deciphering potential molecular mechanisms in clear cell renal cell carcinoma based on the ubiquitin-conjugating enzyme E2 related genes: Identifying UBE2C correlates to infiltration of regulatory T cells.Biofactors. 2025 Jan-Feb;51(1):e2143. doi: 10.1002/biof.2143. Epub 2024 Nov 29. Biofactors. 2025. PMID: 39614426
-
Prognostic Role of SETDB2 in Clear Cell Renal Cell Carcinoma: Linking Immune Infiltration, Cuproptosis, and Tumor Suppression.Cancer Manag Res. 2025 Mar 27;17:675-692. doi: 10.2147/CMAR.S499771. eCollection 2025. Cancer Manag Res. 2025. PMID: 40166493 Free PMC article.
References
-
- Bray F, Ferlay J, Soerjomataram I, Siegel RL, Torre LA, Jemal A. Global cancer statistics 2018: GLOBOCAN estimates of incidence and mortality worldwide for 36 cancers in 185 countries. CA Cancer J Clin. 2018;68:394–424. - PubMed
-
- Capitanio U, Montorsi F. Renal cancer. Lancet (London England). 2016;387:894–906. - PubMed
-
- Bhatt JR, Finelli A. Landmarks in the diagnosis and treatment of renal cell carcinoma. Nat Rev Urol. 2014;11:517–25. - PubMed
-
- Siegel RL, Miller KD, Jemal A. Cancer statistics, 2019. CA Cancer J Clin. 2019;69:7–34. - PubMed
-
- Awakura Y, Nakamura E, Ito N, Kamoto T, Ogawa O. Methylation-associated silencing of SFRP1 in renal cell carcinoma. Oncol Rep. 2008;20:1257–63. - PubMed
LinkOut - more resources
Full Text Sources