. 2025 Jun 24;44(6):115864.
doi: 10.1016/j.celrep.2025.115864. Epub 2025 Jun 14.

Modulation of motor excitability reflects traveling waves of neural oscillations

Affiliations

Modulation of motor excitability reflects traveling waves of neural oscillations

Zachary J Haigh et al. Cell Rep. .

Abstract

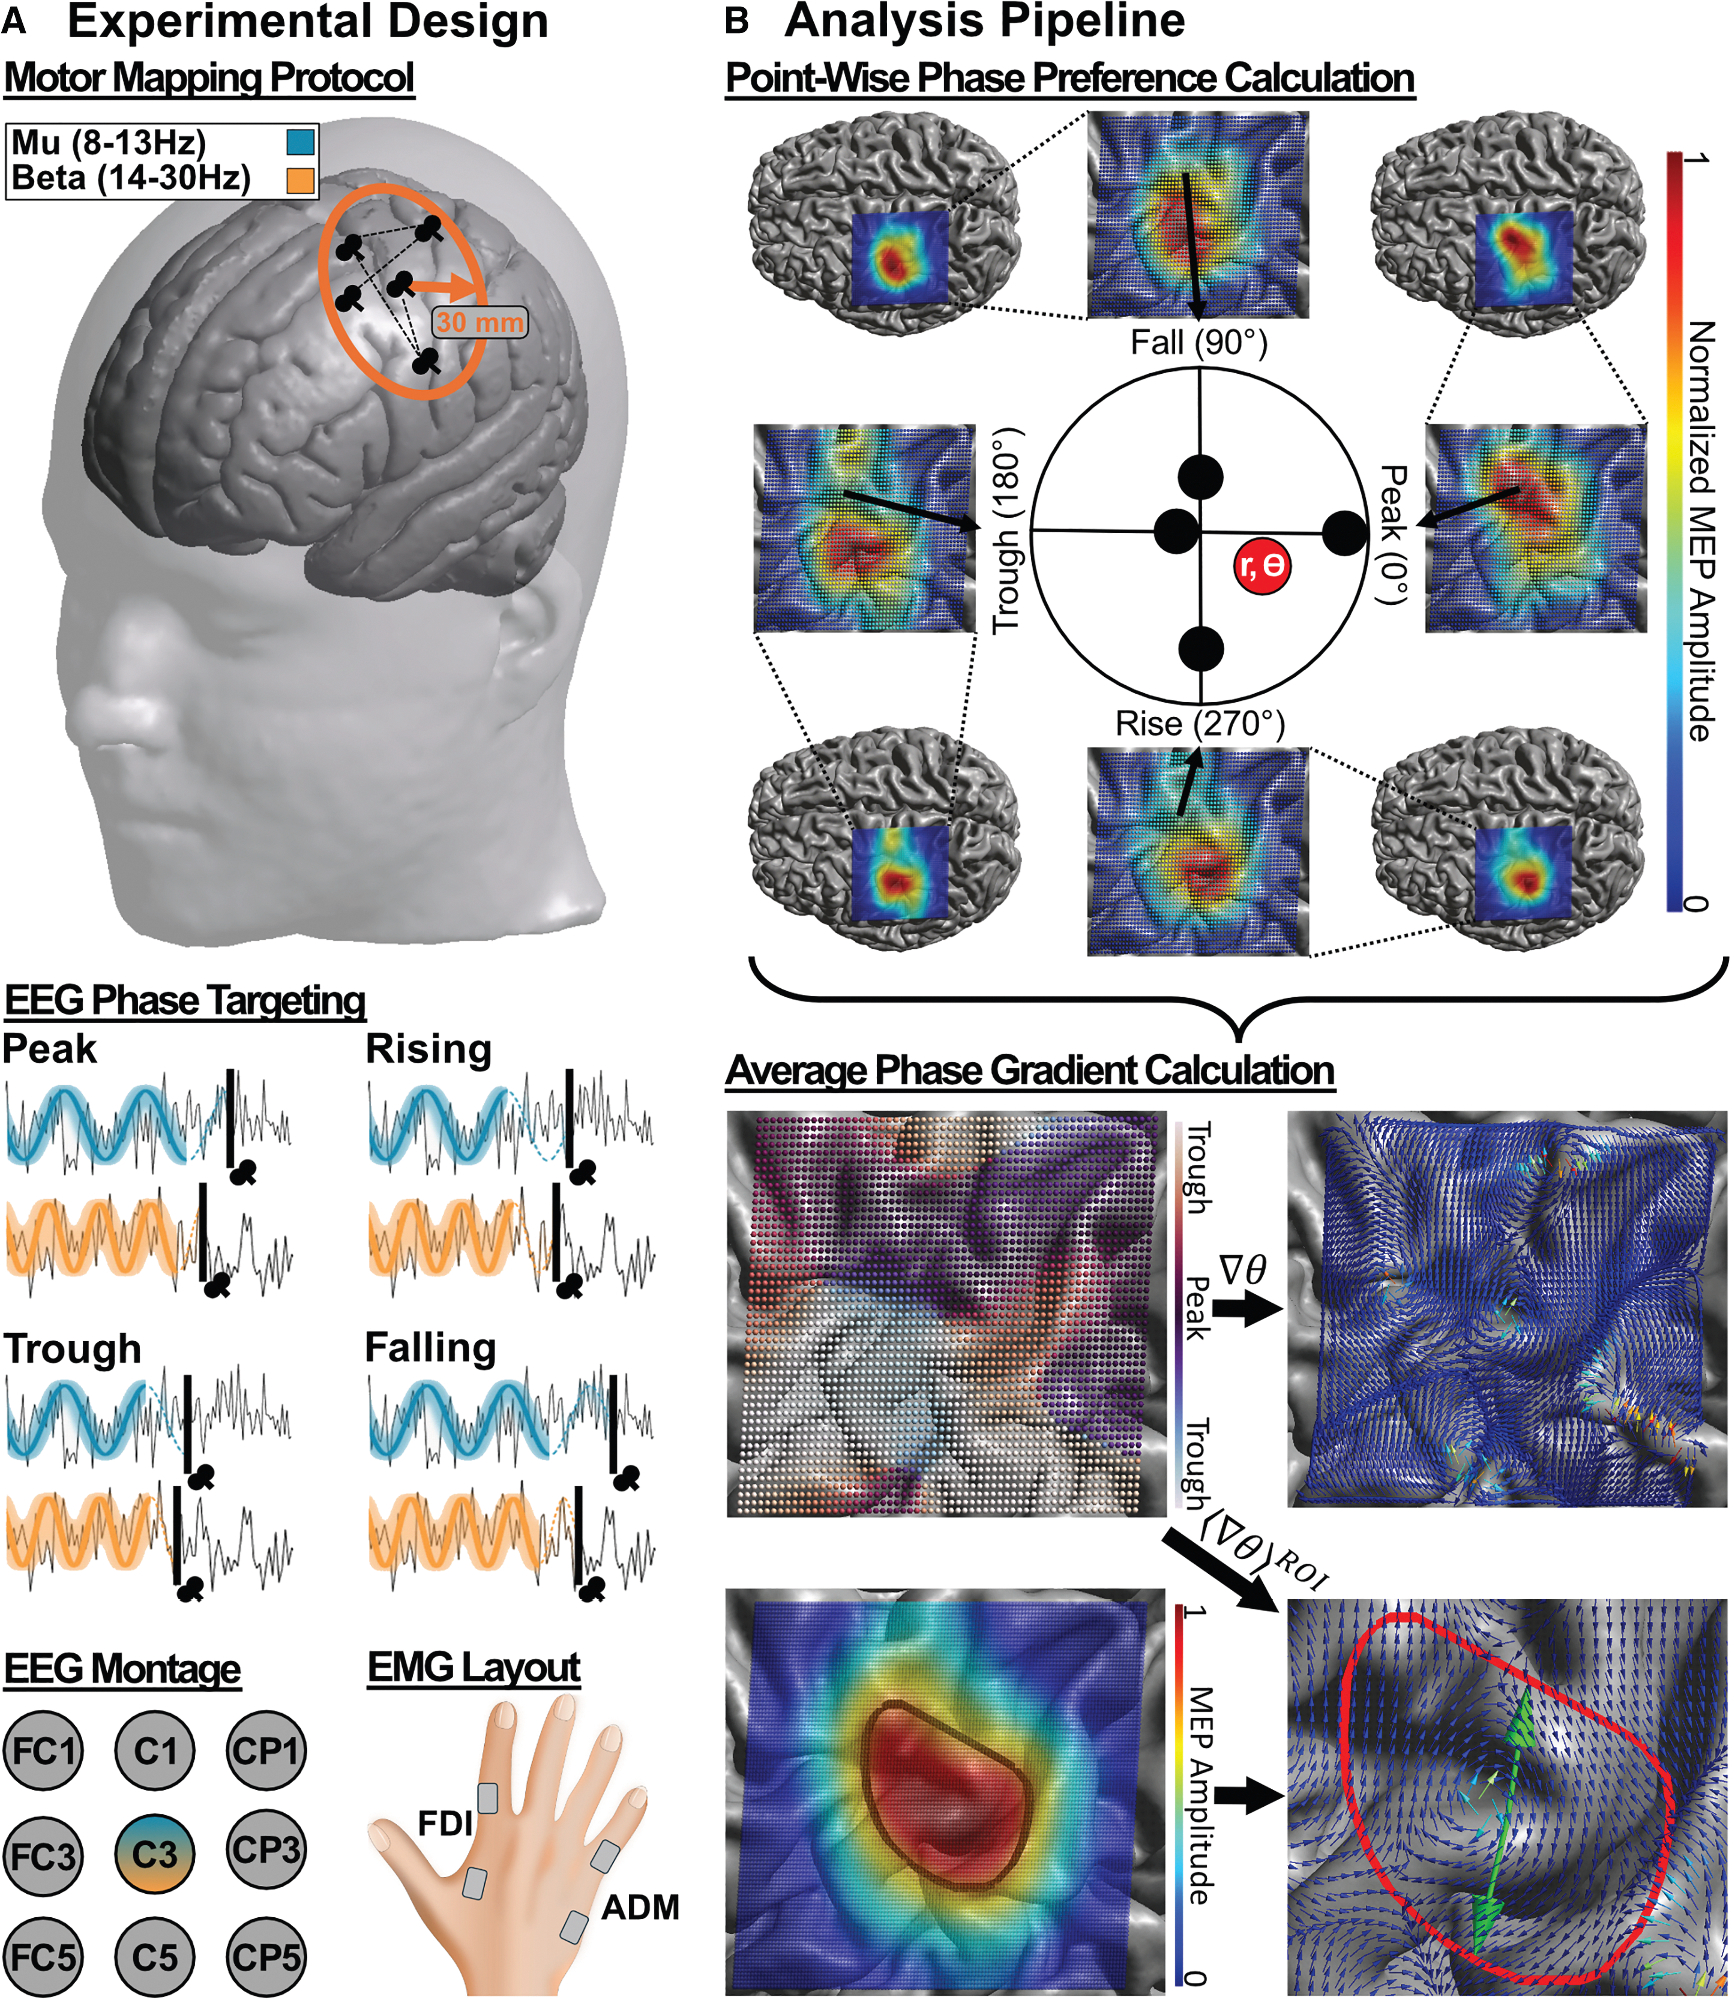
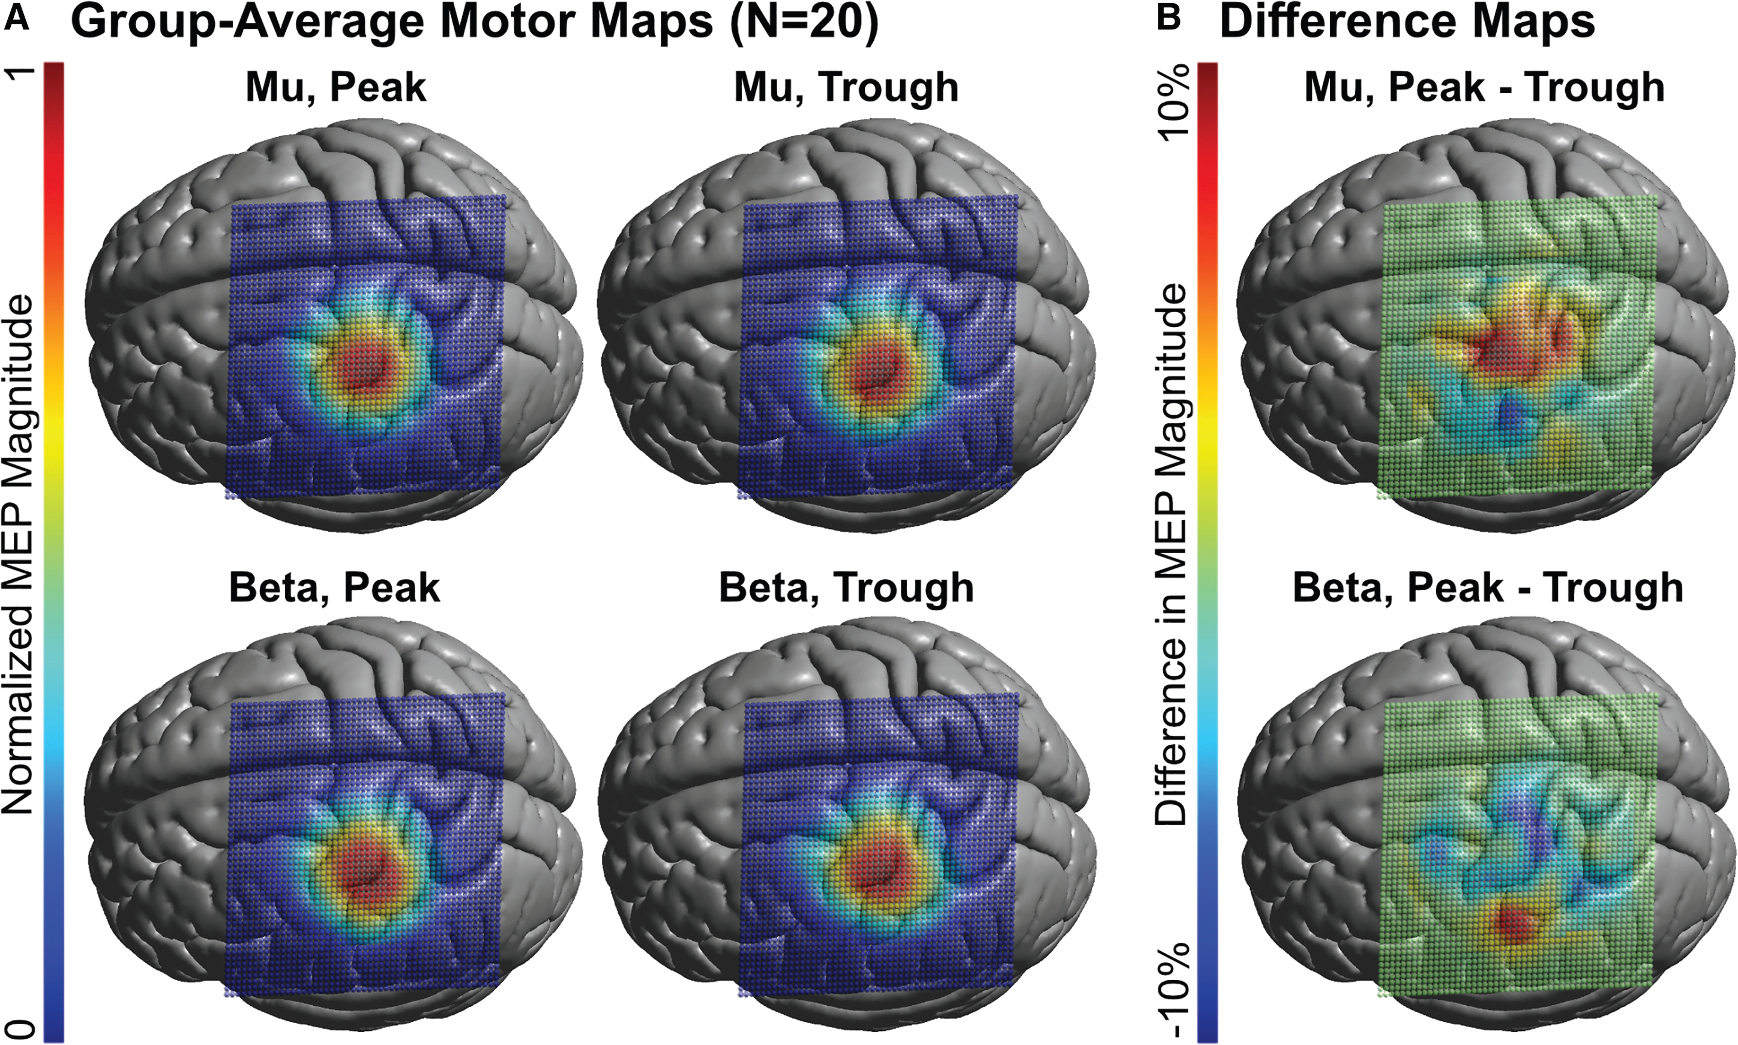
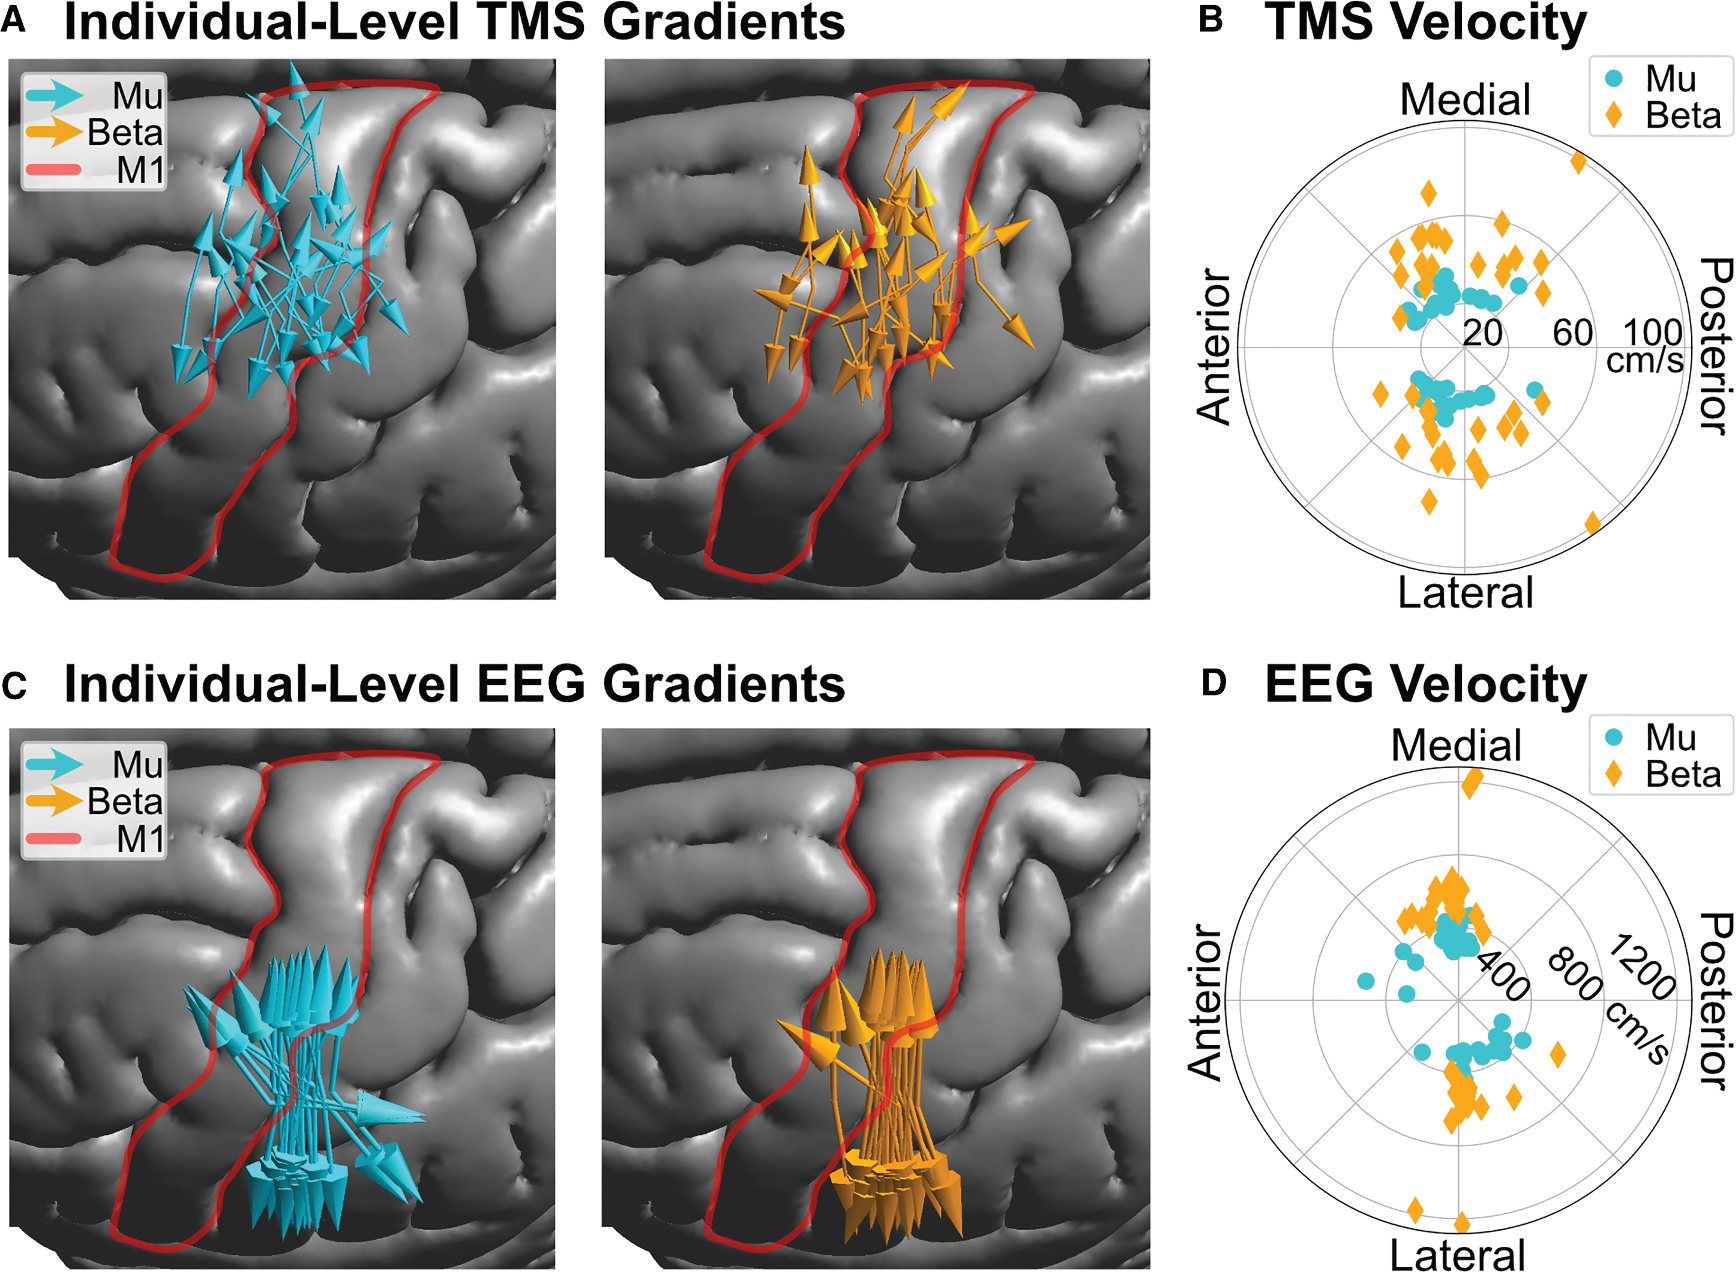
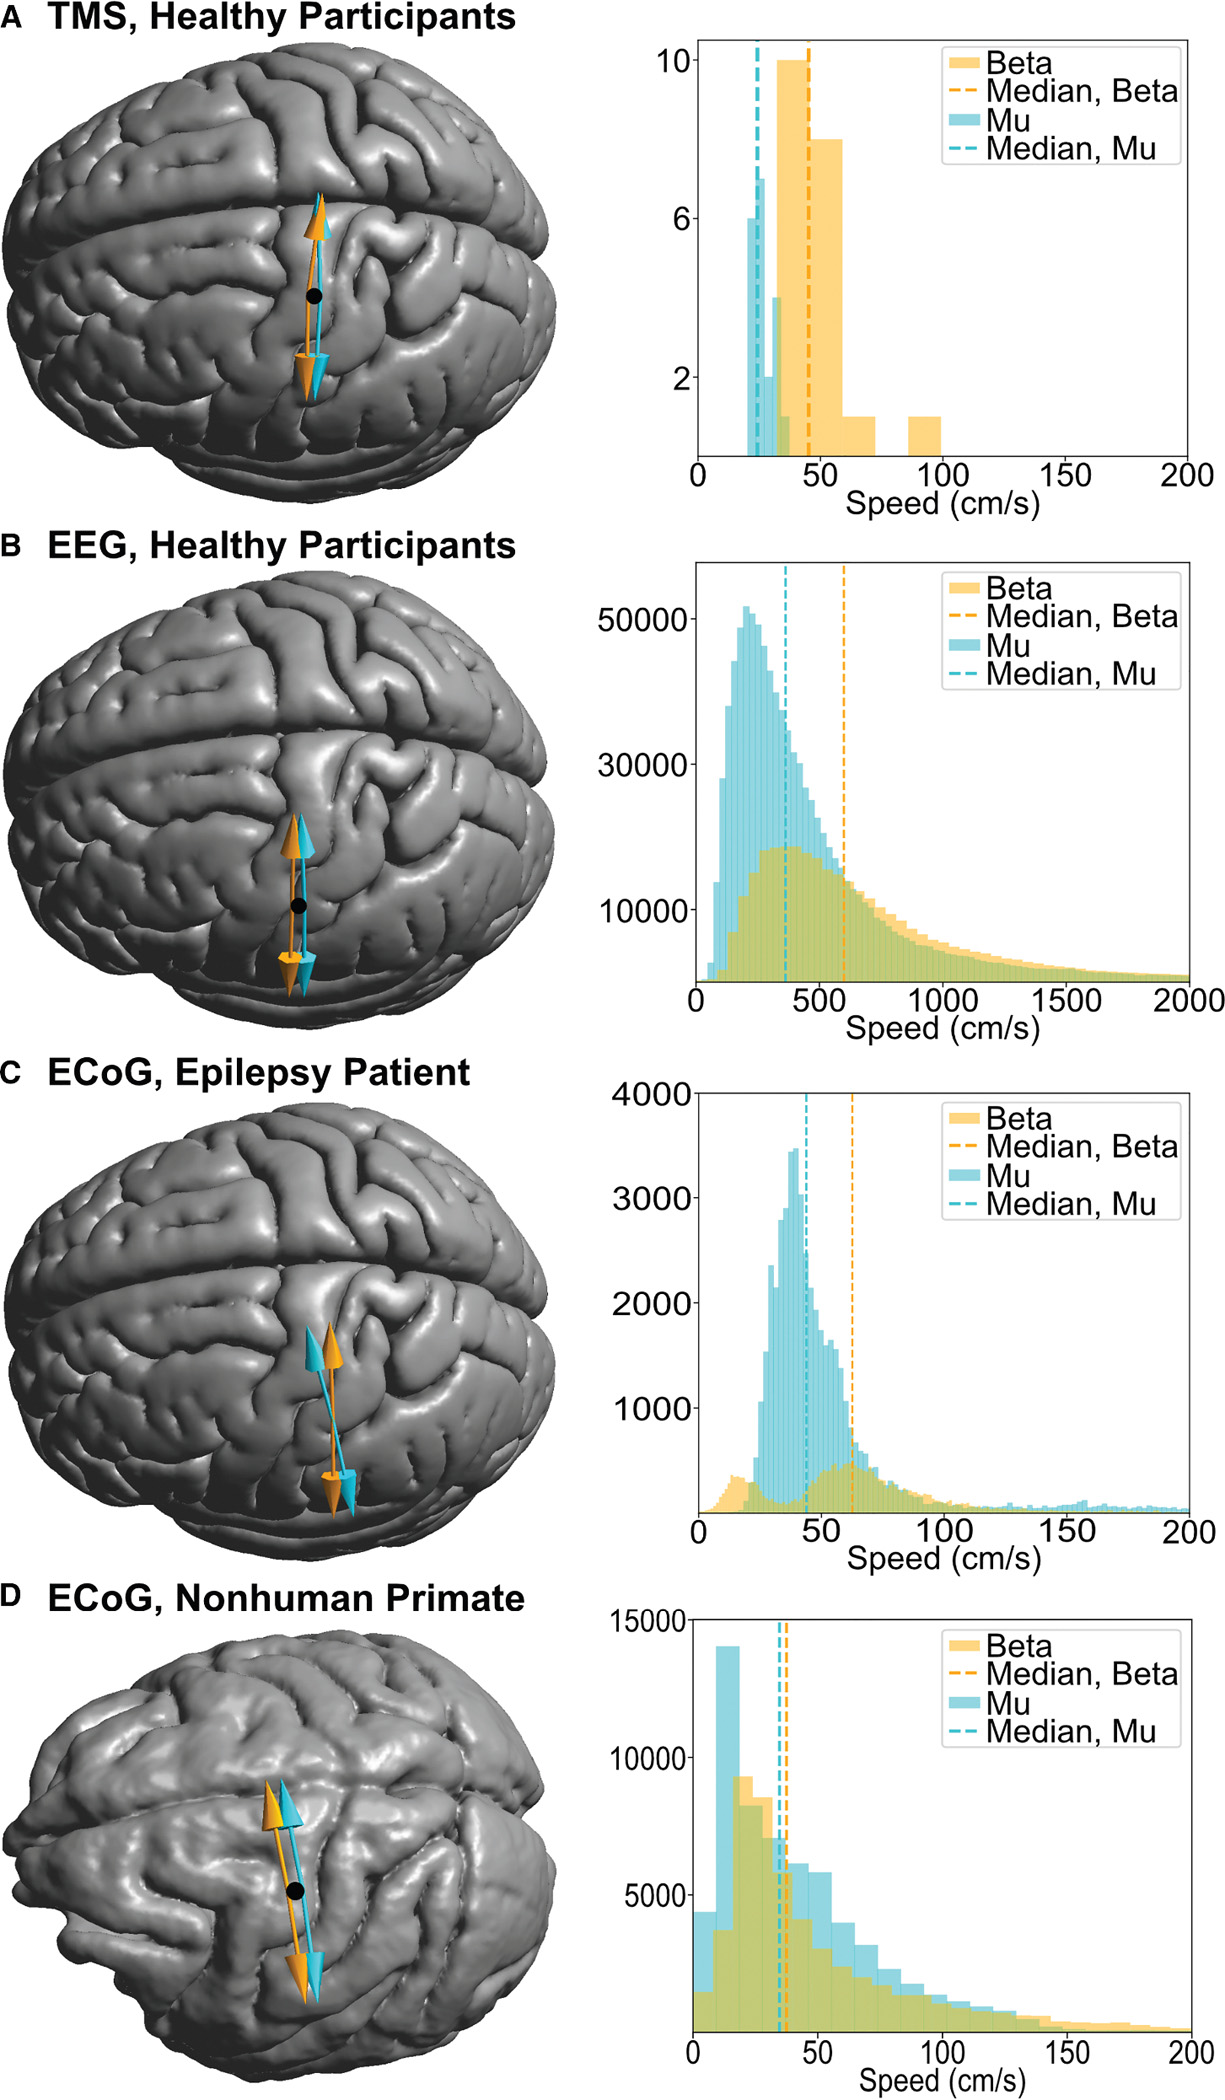
Neural traveling waves represent an important endogenous phenomenon with structural and functional relevance in the human brain. These waves, commonly recorded via electroencephalogram (EEG) or electrocorticography (ECoG), are implicated in a range of brain processes. However, it remains unclear how they influence neural excitability across brain regions. Advancements in real-time control of brain stimulation present opportunities to compare traveling waves and excitation. Here, we investigate how sensorimotor mu (8-13 Hz) and beta (14-30 Hz) traveling waves affect motor cortex excitability using real-time EEG-controlled transcranial magnetic stimulation (TMS). We observed gradients in the mediolateral direction and then validated these findings using ECoG recordings in a human participant and a nonhuman primate. Our results demonstrate that neuronal excitability reflects the natural patterns of sensorimotor traveling waves. This provides important evidence of traveling waves modulating neural excitability in humans. This opens possibilities for more effective stimulation protocols aligned with intrinsic brain dynamics.

Keywords: CP: Neuroscience; TMS-EEG; closed-loop; electrocorticography; electroencephalography; motor cortex; real-time stimulation; transcranial magnetic stimulation; traveling waves.


Conflict of interest statement

Declaration of interests A.O., I.A., and S.S. are inventors on patent applications describing TMS closed-loop stimulation technology.

Figures

Figure 1.
Figure 1.. Experimental design
(A) Motor mapping is performed with TMS pulses applied at pseudorandom spatial locations within a region with a minimum radius of 30 mm (extending beyond to fully capture the area of activation as needed). The session is split in half to target both mu (8–13 Hz) and beta (14–30 Hz) in randomized order. TMS pulses are delivered at four phases (peak, rise, trough, and fall) of each target frequency as a quadruplet of randomized order for each stimulation location. Oscillation phase is extracted via EEG using a Laplacian spatial filtering centered around C3 to ensure precise localization of the signal. Electromyography (EMG) data are collected from the FDI and ADM muscles. (B) Analysis pipeline. The amplitude of motor-evoked potentials (MEPs) for each TMS pulse is recorded and interpolated to a uniformly spaced grid at each phase of each frequency. Phase preference is calculated as a point-wise circular average using the four phases in each frequency band. Each point in the motor map yields a magnitude and phase (r, ϴ) pairing. The gradient of preferred phase can then be calculated on a point-wise basis. We determined the dominant gradient direction in a region of interest defined as the 75th percentile of the overall (combining all phases and frequencies) motor map for each participant.
Figure 2.
Figure 2.. TMS motor maps for mu and beta frequencies
(A) Group-average motor maps. Shown are average motor maps (N = 20, MNI space) for the peak and trough of the mu and beta rhythms. Motor maps do not differ in their COG location for phase and frequency along with visually similar distributions. (B) Difference maps. Subtracting group-average motor maps across phase reveals differences between motor map distributions for peak and trough, specifically in mediolateral directions. Additionally, the mediolateral trends flip when comparing difference maps for the mu and beta rhythms. This shows that phase and frequency influence the spatial distribution of TMS-induced excitability.
Figure 3.
Figure 3.. Individual-level data of phase gradients
(A) Subject-level TMS gradients. Shown are average gradients of TMS phase preference for each participant, centered at each participant’s MNI-transformed COG. The gray matter surface is aligned to show the left hemisphere with the frontal lobe pointing left and the precentral gyrus is outlines in red. The gradient direction is aligned in a mediolateral orientation with minor anteroposterior components. (B) TMS velocity. Shown are participant-level TMS gradient velocity polar plots with speed represented radially (cm/s) and direction represented as an angle (posterior: 0°, medial: 90°, anterior: 180°, lateral: 270°). Both mu and beta gradients are aligned in a mediolateral orientation. (C) Individual-level EEG gradients. Shown are average gradients of EEG traveling waves for each participant centered at C3 with a random jitter to visually differentiate each arrow. The same MNI brain orientation as in (A) is used here. Gradient directions demonstrate lower variability than TMS with similar mediolateral directionality. (D) EEG velocity. Polar plots show speeds radially (cm/s) and angular gradient directions (posterior: 0°, medial: 90°, anterior: 180°, lateral: 270°). Individual gradient velocities demonstrate approximately 2-fold increases in speed for beta relative to mu. Velocities in EEG are a 10-fold increase upon those shown for TMS and consistent with literature findings.
Figure 4.
Figure 4.. Comparison of traveling waves across modalities
(A) TMS phase gradients in healthy participants. Shown are group-averaged (N = 20) phase gradients for mu (blue) and beta (orange) plotted in MNI (left) and gradient speed histograms (right). Gradient arrows are artificially shifted due to overlapping presentation. The black dot indicates the true center location for both arrows. (B) EEG traveling waves in healthy participants. Shown are group-averaged (N = 20) EEG traveling wave gradients shown on the gray matter surface of the MNI152 brain. The black dot indicates the true center of the EEG montage. The speed histogram includes all speed samples from all participants that corresponded to a PGD value of greater than 0.7. Note the 10-fold increase in speed relative to TMS and ECoG results. (C) ECoG traveling waves in human ECoG data. Shown are resting-state traveling waves extracted from a 4 × 4 grid of ECoG electrodes. Average directions are presented on the MNI brain (left), and speed is presented in a histogram (right). (D) ECoG traveling waves in NHP. Shown are resting-state traveling waves extracted from 51 ECoG electrodes in the sensorimotor region. Average directions are presented on the NHP gray matter with an artificial shift (black dot at center, left). Speed is presented in a histogram (right). The TMS-extracted phase gradients yield results similar to the two classically obtained traveling wave examples presented here. Speed and direction are comparable in all three cases despite differing methods and populations.

Similar articles

References

    1. Buzsáki G, Anastassiou CA, and Koch C (2012). The origin of extracellular fields and currents-EEG, ECoG, LFP and spikes. Nat. Rev. Neurosci. 13, 407–420. 10.1038/nrn3241. - DOI - PMC - PubMed
    1. Buzsáki G (2004). Large-scale recording of neuronal ensembles. Nat. Neurosci. 7, 446–451. 10.1038/nn1233. - DOI - PubMed
    1. Ermentrout GB, and Kleinfeld D (2001). Viewpoint Traveling Electrical Waves in Cortex: Insights from Phase Dynamics and Speculation on a Computational Role the Results The Amplitude of the Wave Is a Periodic Function of Time. Soc. Neurosci. 29, 33–44. - PubMed
    1. Hughes JR (1995). The Phenomenon of Travelling Waves: A Review. Clin. Electroencephalogr. 26, 1–6. - PubMed
    1. Hindriks R, van Putten MJAM, and Deco G (2014). Intra-cortical propagation of EEG alpha oscillations. Neuroimage 103, 444–453. - PubMed

LinkOut - more resources