. 2025 Jun 15;13(6):e011537.
doi: 10.1136/jitc-2025-011537.

Multiomics identifies tumor-intrinsic SREBP1 driving immune exclusion in hepatocellular carcinoma

Affiliations

Multiomics identifies tumor-intrinsic SREBP1 driving immune exclusion in hepatocellular carcinoma

Rebekah E Dadey et al. J Immunother Cancer. .

Abstract

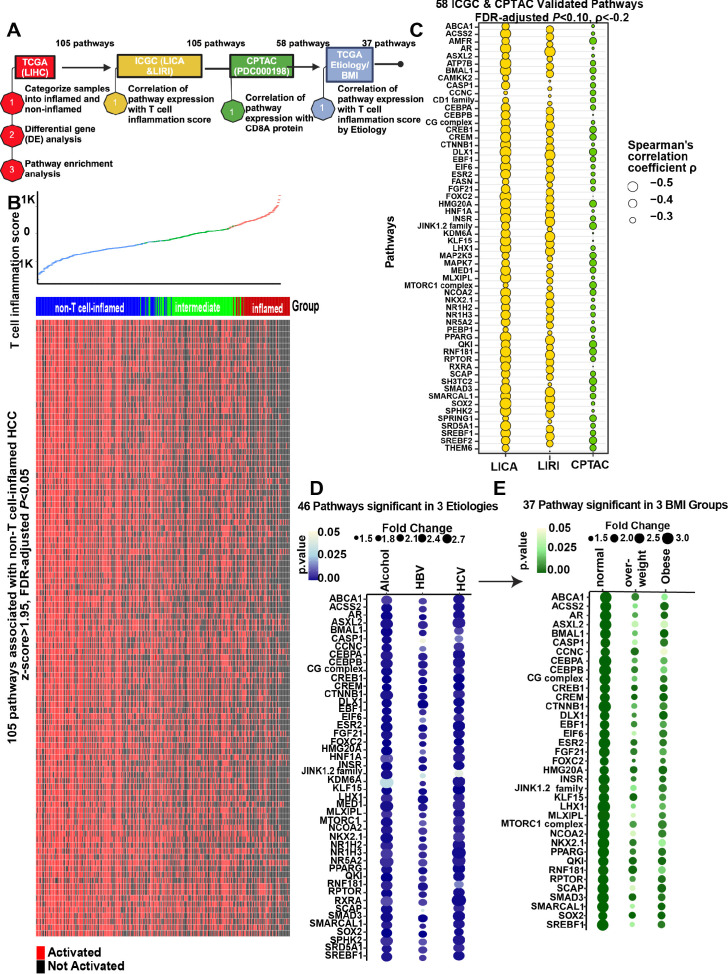
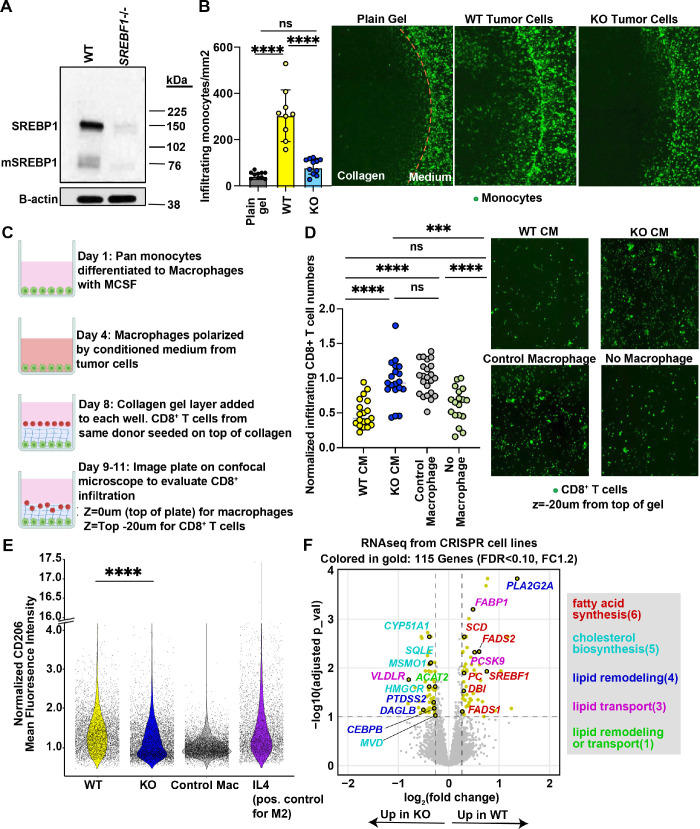
Immune checkpoint inhibitors (ICI) have improved patient outcomes in hepatocellular carcinoma (HCC); however, most patients do not experience durable benefit. The non-T cell-inflamed tumor microenvironment, characterized by limited CD8+ T-cell infiltration, reduced dendritic cell function, and low interferon-γ-associated gene expression, is associated with a lower likelihood of response to ICI. To nominate new therapeutic targets for overcoming ICI resistance in HCC, we conducted a large-scale multiomic analysis on 900+human specimens (RNA sequencing (RNA-seq), proteomics) and 31 tumor single-cell (sc) RNA-seq samples, with tissue validation through imaging mass cytometry (IMC) and spatial lipidomics by matrix-assisted laser desorption/ionization (MALDI), with experimental investigation by in vitro CD8+ T-cell recruitment and macrophage polarization functional assays using three-dimensional (3D) co-culture models. We discovered 32 oncogenic pathways associated with immune exclusion, with sterol regulatory element binding protein 1 (SREBP1, encoded by SREBF1) as a hub regulator. scRNA-seq analysis showed that SREBP1 signaling is associated with enriched lipid biogenesis pathways in tumor cells, elevated immunosuppressive markers in macrophages, and diminished CD8+ T-cell infiltration. Integration of IMC and MALDI images revealed distinct lipid species differentially abundant in tumor regions with low versus high CD8+ T cell infiltration. Functional studies in a 3D in vitro tumor-immune co-culture system demonstrated that CRISPR-mediated SREBF1 knockout (KO) in HepG2 cells reduced monocyte recruitment, decreased expression of the protumorigenic CD206 marker in macrophages, and enhanced CD8+ T-cell migration compared with wild-type (WT) (p<0.0001). RNA-seq of SREBF1 KO versus WT tumor cells confirmed suppression of lipid biosynthesis genes.Our findings nominate an atlas of tumor-intrinsic drivers of immune exclusion, particularly SREBP1 via pro-tumorigenic macrophage (M2-like) reprogramming. These pathways may represent novel therapeutic targets to enhance antitumor immunity and deserve further study as targeted therapy candidates to enhance ICI in HCC.

Keywords: Hepatocellular Carcinoma; Immunotherapy; Tumor microenvironment - TME.


Conflict of interest statement

Competing interests: RB declares PCT/US15/612657 (Cancer Immunotherapy), PCT/US18/36052 (Microbiome Biomarkers for Anti-PD-1/PD-L1 Responsiveness: Diagnostic, Prognostic and Therapeutic Uses Thereof), PCT/US63/055227 (Methods and Compositions for Treating Autoimmune and Allergic Disorders). JJL declares DSMB: AbbVie, Immutep; Scientific Advisory Board: (no stock) 7 Hills, Fstar, Inzen, RefleXion, Xilio (stock) Actym, Alphamab Oncology, Arch Oncology, Kanaph, Mavu, Onc.AI, Pyxis, Tempest; Consultancy with compensation: AbbVie, Alnylam, Avillion, Bayer, Bristol-Myers Squibb, Checkmate, Codiak, Crown, Day One, Eisai, EMD Serono, Flame, Genentech, Gilead, HotSpot, Kadmon, KSQ, Janssen, Ikena, Immunocore, Incyte, Macrogenics, Merck, Mersana, Nektar, Novartis, Pfizer, Regeneron, Ribon, Rubius, Silicon, Synlogic, Synthekine, TRex, Werewolf, Xencor; Research Support: (all to institution for clinical trials unless noted) AbbVie, Agios (IIT), Astellas, AstraZeneca, Bristol-Myers Squibb (IIT & industry), Corvus, Day One, EMD Serono, Fstar, Genmab, Ikena, Immatics, Incyte, Kadmon, KAHR, Macrogenics, Merck, Moderna, Nektar, Next Cure, Numab, Pfizer (IIT & industry) Replimmune, Rubius, Scholar Rock, Synlogic, Takeda, Trishula, Tizona, Xencor; Patents: (both provisional) Serial #15/612,657 (Cancer Immunotherapy), PCT/US18/36052 (Microbiome Biomarkers for Anti-PD-1/PD-L1 Responsiveness: Diagnostic, Prognostic and Therapeutic Uses Thereof). SPM declares research grants from Alnylam Pharmaceuticals and Fog Pharmaceuticals and is a consultant for and on Advisory Boards for Surrozen, AntlerA, Alnylam, Mermaid Bio, Vicero Inc, and UbiquiTx; however, there are no pertinent conflicts of interest related to the current manuscript. Correspondence and requests for materials should be addressed to JJL (lukejj@upmc.edu) and RB (baor@upmc.edu). The remaining authors declare no competing interests.

Figures

Figure 1
Figure 1. Identification of oncogenic pathways associated with a non-T cell-inflamed tumor microenvironment in HCC. (A) Schema of immune exclusion pathway discovery and validation workflow in human specimens. (B) T cell-inflamed gene expression signature with 105 pathways (z-score >1.95, p<0.05) by causal network analysis (Ingenuity) shown at per patient level in TCGA-LIHC primary tumors. Annotation bar above the heatmap indicates tumor groups. Columns represent individual tumors and rows represent pathways. For each pathway, its status in individual samples was determined as activated if at least 50% or more of genes in each pathway were above median expression for that gene. (C) 58 pathways were validated in ICGC (yellow, two cohorts), and CPTAC (green) HCC cohorts by Spearman’s correlation coefficient ρ<−0.2 (FDR-adjusted p<0.10). (D) 46 pathways from C were validated across HCC etiology (p<0.05, expression fold change>1.1). (E) 37 pathways from D were validated across BMI categories (p<0.05, FC>1.1). Two-sided Welch two-sample t-test was used in D and E. BMI, body mass index; CPTAC, Clinical Proteomic Tumor Analysis Consortium; FDR, false discovery rate; HCC, hepatocellular carcinoma; ICGC, International Cancer Genome Consortium; LICA: Liver Cancer dataset; LIHC, liver hepatocellular carcinoma; LIRI, Liver Cancer-Riken dataset; TCGA, The Cancer Genome Atlas.
Figure 2
Figure 2. Tumor cell SREBP1 activation is associated with low T-cell infiltration in HCC. (A) Human single-cell RNA sequencing (scRNA-seq) cohorts in this study, including the UPitt cohort and four published cohorts. (B and C) reciprocal PCA (RPCA) integrated UMAP of single cells from all 31 HCC tumor samples, colored by (B) main tumor/immune/stromal cell types or (C) individual tumor sample. Cell types were classified by SingleR with manual curation in B. Samples from UPitt were named after LCC in C, with other tumor names as originally published. UMAP shown in B and C is using normalized data after RPCA integration for visualization purposes only. (D) 32 out of 37 pathways (from figure 1E) showed elevated expression in tumor cells from low-T cell-infiltrated HCCs as compared with tumor cells from high-T cell-infiltrated HCCs (FDR-adjusted p<0.10). x-axis shows the estimated coefficient value for a fixed effect (tumor group) shown from linear mixed-effects models (LMM; group as fixed effect, tumor name nested within study id as random effect). For each pathway, its expression score was computed as mean expression of differentially expressed genes involved in that pathway. (E) The 32 pathways from D are dominantly expressed in malignant hepatocytes compared with other cell populations. Denotation: ****p<0.0001. Statistical analysis of pathway expression scores in D and E was performed by LMM (with study id (batch) as random effect) on normalized data without RPCA integration process per Seurat best practice. (F) Protein-protein interaction network analysis of 32 pathways from D using STRING (confidence score >0.4, active interaction sources as “Experiments”, “Databases”, or “Co-expression”). (G) Representative examples of HCC spatial transcriptomics by Visium showing SREBP1-high tumors are immune-excluded (patient samples HCC-1T, HCC-2T). Results of all six Visium samples are provided in online supplemental figure S4A,B. (H) SREBP1 pathway score was calculated from bulk RNA-seq from non-responders (NR) and responders (R) to immune checkpoint inhibitors. Samples compared using two-sided Welch two-sample t-test. (I) Individual gene expression of the SREBP1 pathway comparing NR and R with individual patients as column identifier and SREBP1 pathway genes as row identifier. n=17 patients in H and I. (J) Imaging mass cytometry (IMC) and matrix-assisted laser desorption/ionization (MALDI) imaging schema. (K) Representative image of IMC with colors representing annotated cell types and markers (left/middle: without/with annotation masks) and example C46H79O10P_CL MALDI lipid abundance image for each ROI. (L) Volcano plot depicting lipid species upregulated (blue dots) or downregulated (red dots) in tumor cells measured by MALDI comparing ROIs with low versus high CD8+ T-cell density. Two-sided Welch two-sample t-test was used in L. Colored dots denote differentially abundant lipid species at nominal p<0.05 and log2 fold change >0.4 or <−0.4. DC, dendritic cell; HCC, hepatocellular carcinoma; LCC, Liver Cancer Center; NK, natural killer; PCA, Principal Component Analysis; RNA-seq, RNA sequencing; ROI, region of interest; SREBP1, sterol regulatory element binding protein 1; UMAP, Uniform Manifold Approximation and Projection; FDR, false discovery rate.
Figure 3
Figure 3. M2-like macrophages are enriched in HCCs of low T-cell infiltration. (A) Reciprocal PCA (RPCA) integrated UMAP of 31 HCC single-cell RNA sequencing tumor samples split by CD8+ T cell-infiltration group. Colors indicate CD8+ T cells, macrophages, or all other cells. (B) Boxplot indicating the percentage of indicated immune cell type over all immune cells, with each point from an individual HCC sample. Statistics performed with unintegrated data using two-sided Welch two-sample t-test (FDR-adjusted). (C) Single-cell feature expression heatmap of DEGs comparing macrophages in low-T versus high-T cell-infiltrated HCCs (FDR-adjusted p<0.10). On the column: n=16,952, 15,198, and 1,988 macrophages from low/med/high-T cell-infiltrated HCCs. On the row: 104 genes with known functions in M1-like or M2-like macrophage polarization based on literature, sorted by positive to negative fold changes (top to bottom). Gene symbols are shown to the left of the heatmap. Statistics by LMM (group as fixed effect, tumor name nested within study id as random effect). (D) Percentage of DEGs from macrophages indicated in M1-like, M2-like, M1_M2-like (ambiguous), or unknown polarization function. Statistics by two-sided Fisher’s exact test. (E) Expression of canonical M1 and M2 gene signatures in macrophages between low/high tumor groups. Expression was computed as mean expression of all genes in each signature. Statistics performed by linear mixed-effects models (LMM). p=0.0019 (**) for M1 signature (left) and 0.039 (*) for M2 signature (right). DEG, differentially expressed gene; FDR, false discovery rate; HCC, hepatocellular carcinoma; LMM, linear mixed-effects models; Mac, macrophage; NK, natural killer; PCA, Principal Component Analysis; UMAP, Uniform Manifold Approximation and Projection.
Figure 4
Figure 4. Tumor cell SREBP1 promotes monocyte infiltration, macrophage reprogramming towards an M2-like state and suppresses CD8+ T-cell recruitment in 3D co-culture models. (A) Western blot of immature SREBP1 (top), mature/cleaved SREBP1 (bottom) and B-actin from WT or SREBF1 CRISPR KO cells. (B) Tumor cells (WT or KO) were seeded in a 3D collagen droplet and the recruitment of GFP-labeled monocytes was monitored for 4 days. Cells were imaged on a confocal microscope. Representative images on the right. Statistics by two-sided Welch two-sample t-test (FDR-adjusted). (C) Macrophage reprograming using tumor-conditioned medium and CD8+ T-cell recruitment schema. (D) Quantification of labeled CD8+ T-cell migration towards macrophage-free collagen matrix (no macrophage) or collagen matrices seeded with macrophages previously treated with tumor-conditioned media (WT CM and KO CM) or control medium (control macrophages). Representative confocal images on right. Statistics by ordinary one-way analysis of variance (FDR-adjusted). (E) CD206 immunofluorescence staining of macrophages treated with conditioned media from WT or KO tumor cells, control macrophages, and IL-4 (M2-like polarization control). Statistics by linear mixed-effects models (LMM; treatment as fixed effect, experimental replicate as random effect). (F) Volcano plot of bulk RNA-seq DEGs comparing SREBF1 CRISPR KO to WT cells. DEGs were identified using limma voom with precision weights. Gold-colored dots represent 115 genes at FDR-adjusted p<0.10 and fold change >1.2 or <−1.2 (dashed lines). Gold-colored dots with black outline denote 19 genes directly involved in lipid metabolism based on literature, with text color indicating various categories. ns=not significant in B and D. Denotation: ***p<0.001, ****p<0.0001 in B D and E. DEG, differentially expressed gene; FDR, false discovery rate; IL, interleukin; KO, knockout; RNA-seq, RNA sequencing; SREBP1, sterol regulatory element binding protein 1; WT, wild-type; 3D, three-dimensional.

References

    1. Luo XY, Wu KM, He XX. Advances in drug development for hepatocellular carcinoma: clinical trials and potential therapeutic targets. J Exp Clin Cancer Res. 2021;40:172. doi: 10.1186/s13046-021-01968-w. - DOI - PMC - PubMed
    1. Ayers M, Lunceford J, Nebozhyn M, et al. IFN-γ-related mRNA profile predicts clinical response to PD-1 blockade. J Clin Invest. 2017;127:2930–40. doi: 10.1172/JCI91190. - DOI - PMC - PubMed
    1. Ji R-R, Chasalow SD, Wang L, et al. An immune-active tumor microenvironment favors clinical response to ipilimumab. Cancer Immunol Immunother. 2012;61:1019–31. doi: 10.1007/s00262-011-1172-6. - DOI - PMC - PubMed
    1. Spranger S, Bao R, Gajewski TF. Melanoma-intrinsic β-catenin signalling prevents anti-tumour immunity. Nature New Biol. 2015;523:231–5. doi: 10.1038/nature14404. - DOI - PubMed
    1. Luke JJ, Bao R, Sweis RF, et al. WNT/β-catenin Pathway Activation Correlates with Immune Exclusion across Human Cancers. Clin Cancer Res. 2019;25:3074–83. doi: 10.1158/1078-0432.CCR-18-1942. - DOI - PMC - PubMed

MeSH terms

Substances