

Hypoxia-related signatures predicts survival, immunosuppression and PARP inhibitor resistance in HCC
- PMID: 40518504
- PMCID: PMC12167732
- DOI: 10.1007/s12672-025-02923-3
Hypoxia-related signatures predicts survival, immunosuppression and PARP inhibitor resistance in HCC
Abstract
Background: Despite extensive research on hypoxia in hepatocellular carcinoma (HCC), previous studies have relied on pre-existing hypoxia gene sets, limiting their specificity. We developed a novel approach using direct comparison of hypoxic versus normoxic HCC cell lines to establish a more precise hypoxia signature.
Methods: Through differential gene expression analysis of HCC cells under controlled oxygen conditions (GSE185969) and integration with TCGA-LIHC data, we identified and validated a highly specific 29-gene hypoxia signature. We performed comprehensive immune profiling and genomic instability analyses using multi-omics approaches.
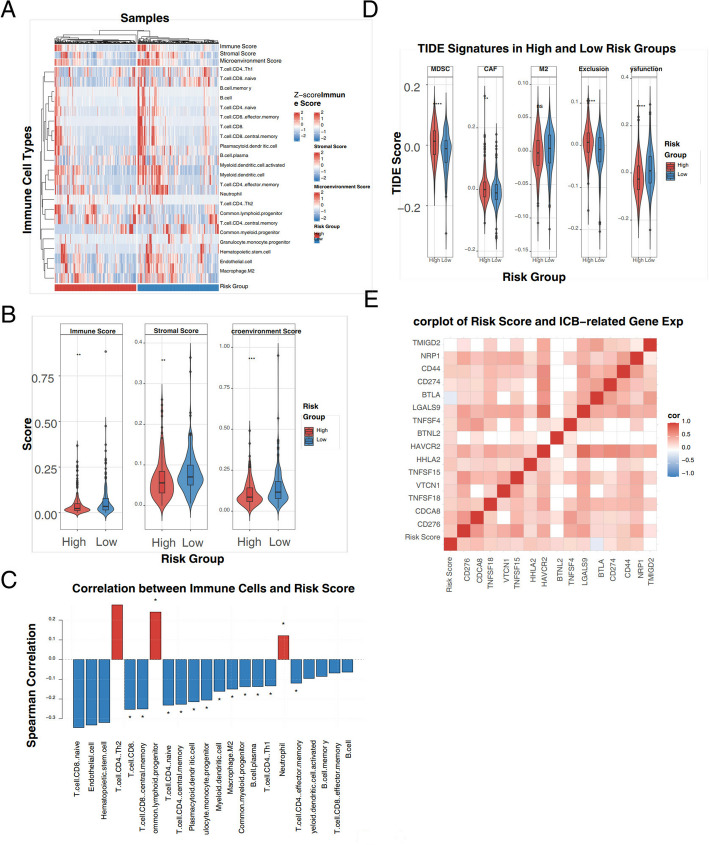
Results: Our HCC-specific hypoxia signature demonstrated superior prognostic value (AUC: 0.805, 0.805, 0.748 at 1/3/5 years) compared to conventional hypoxia markers. High-risk tumors showed distinct immunosuppressive features including reduced CD8 + T cells and elevated Th2 cells, along with significantly increased expression of immune checkpoints CD274 (PD-1, p < 0.05) and CD276 (B7-H3, r = 0.62, p < 0.001). Notably, we uncovered an unexpected inverse relationship between hypoxia-induced genomic instability and PARP inhibitor sensitivity, challenging current therapeutic paradigms.
Conclusion: Our methodology establishes a more precise hypoxia signature specific to HCC, advancing beyond traditional approaches. The paradoxical finding of reduced PARP inhibitor sensitivity in genomically unstable tumors reveals new complexities in hypoxia-driven treatment resistance, suggesting the need for alternative therapeutic strategies in hypoxic HCC.
Keywords: Genomic instability; Hepatocellular carcinoma; Hypoxia; Prognostic signature; Tumor immune microenvironment.
© 2025. The Author(s).
Conflict of interest statement
Declarations. Competing interests: The authors declare that they have no competing interests. Ethics approval and consent to participate: The research was conducted in accordance with the International Conference and the Declaration of Helsinki. Consent for publication: All authors have consented to the publication of this manuscript. Clinical trial number: Not applicable.
Figures


Similar articles
-
Identifying a Hypoxia-Related Long Non-Coding RNAs Signature to Improve the Prediction of Prognosis and Immunotherapy Response in Hepatocellular Carcinoma.Front Genet. 2021 Nov 30;12:785185. doi: 10.3389/fgene.2021.785185. eCollection 2021. Front Genet. 2021. PMID: 34917132 Free PMC article.
-
Hypoxic Characteristic in the Immunosuppressive Microenvironment of Hepatocellular Carcinoma.Front Immunol. 2021 Feb 17;12:611058. doi: 10.3389/fimmu.2021.611058. eCollection 2021. Front Immunol. 2021. PMID: 33679749 Free PMC article.
-
Cuproptosis-Related Signature Predicts the Prognosis, Tumor Microenvironment, and Drug Sensitivity of Hepatocellular Carcinoma.J Immunol Res. 2022 Nov 16;2022:3393027. doi: 10.1155/2022/3393027. eCollection 2022. J Immunol Res. 2022. PMID: 36438201 Free PMC article.
-
A hypoxia-glycolysis-lactate-related gene signature for prognosis prediction in hepatocellular carcinoma.BMC Med Genomics. 2024 Apr 16;17(1):88. doi: 10.1186/s12920-024-01867-x. BMC Med Genomics. 2024. PMID: 38627714 Free PMC article.
-
Hypoxia-driven lncRNA CTD-2510F5.4: a potential player in hepatocellular carcinoma's prognostic stratification, cellular behavior, tumor microenvironment, and therapeutic response.Mol Biol Rep. 2024 Aug 12;51(1):905. doi: 10.1007/s11033-024-09826-6. Mol Biol Rep. 2024. PMID: 39133347
Cited by
-
Clinical Insights on "Severe Hypoxia and Immune‑Related Features Predict Prognosis in Patients with Hepatocellular Carcinoma".Dig Dis Sci. 2025 Jul 28. doi: 10.1007/s10620-025-09259-6. Online ahead of print. Dig Dis Sci. 2025. PMID: 40719831 No abstract available.
References
-
- Sung H, Ferlay J, Siegel RL, Laversanne M, Soerjomataram I, Jemal A, et al. Global cancer statistics 2020: GLOBOCAN estimates of incidence and mortality worldwide for 36 cancers in 185 countries. CA Cancer J Clin. 2021;71(3):209–49. - PubMed
-
- Li J, Liang YB, Wang QB, Li YK, Chen XM, Luo WL, Lakang Y, Yang ZS, Wang Y, Li ZW, Ke Y. Tumor-associated lymphatic vessel density is a postoperative prognostic biomarker of hepatobiliary cancers: a systematic review and meta-analysis. Front Immunol. 2025;15:1519999. 10.3389/fimmu.2024.1519999. - PMC - PubMed
-
- Li J, Wang QB, Liang YB, Chen XM, Luo WL, Li YK, Chen X, Lu QY, Ke Y. Tumor-associated lymphatic vessel density is a reliable biomarker for prognosis of esophageal cancer after radical resection: a systemic review and meta-analysis. Front Immunol. 2024;15:1453482. 10.3389/fimmu.2024.1453482 - PMC - PubMed
-
- Crocetti L, de Baére T, Pereira PL, Tarantino FP. CIRSE standards of practice on thermal ablation of liver tumours. Cardiovasc Intervent Radiol. 2020;43(7):951–62. - PubMed
-
- Wang Z, Liu M, Zhang DZ, Peng ZW, Wen YL, Liang HH, et al. Microwave ablation versus laparoscopic resection as first-line therapy for solitary 3-5-cm HCC. J Clin Med. 2023;12(15):5006.
Grants and funding
LinkOut - more resources
Full Text Sources
Research Materials