

Renal MRI radiomics in Beckwith-Wiedemann syndrome: a novel imaging approach for genotype identification
- PMID: 40518523
- PMCID: PMC12168307
- DOI: 10.1186/s13023-025-03841-x
Renal MRI radiomics in Beckwith-Wiedemann syndrome: a novel imaging approach for genotype identification
Abstract
Purpose: To valuate the role of nonmalignant nephrological findings and renal MRI radiomics in differentiating molecular subtypes of Beckwith-Wiedemann syndrome (BWS).
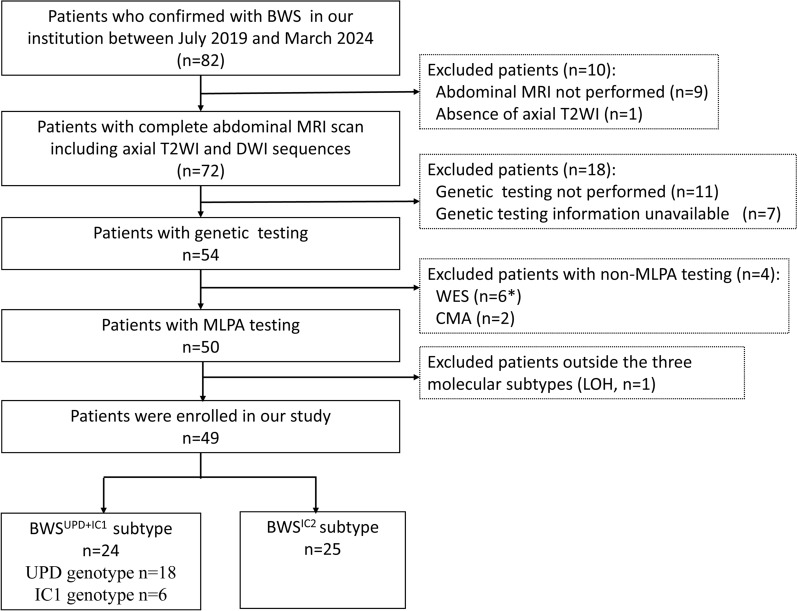
Materials and methods: Clinical data and abdominal MRI scans of 49 patients who underwent partial glossectomy between July 2019 and March 2024 were retrospectively analysed. Patients were categorized into two subtypes: BWSUPD+IC1 (24 cases, with a predisposition to renal involvement) and BWSIC2 (25 cases, with a lower risk of renal involvement), based on genetic testing. Pearson correlation analysis was conducted to evaluate the relationship between patients' age and renal volume. Radiomic features derived from the T2WI sequence and the ADC map were selected to construct single-sequence and combined models. Delong test was used to compare the performance of the models.
Results: Clinically, the BWSUPD+IC1 subtype exhibited a lower incidence of ear creases/pits (P = 0.048) and omphalocele/umbilical hernia (P = 0.032) compared to the BWSIC2 subtype. Abdominal MRI findings indicated the BWSUPD+IC1 subtype had larger total renal volume (P = 0.017) and a weaker correlation between total renal volume and patients' age (r = 0.38). Notably, 91.84% (45/49) of BWS patients exhibited a total renal volume exceeding the normal population's upper limit, with the IC1 subtype demonstrating the largest mean volume. The BWSUPD+IC1 subtype showed higher incidences of nonmalignant renal (P = 0.013) and non-renal abdominal abnormalities. The T2WI, ADC, and combined models achieved the highest area under the receiver operating characteristic (ROC) curves (AUCs) of 0.837, 0.882 and 0.954 (P > 0.05), respectively.
Conclusion: Nonmalignant renal abnormalities and MRI radiomics models have potential as alternative imaging tools for the identification of renal predisposition genotypes and the surveillance of renal size change in BWS patients.
Keywords: Beckwith–Wiedeman syndrome; Genotype; Kidney; Radiomics.
© 2025. The Author(s).
Conflict of interest statement
Declarations. Ethics approval and consent to participant: This retrospective study was approved by the research ethics committee of our hospital (Approval Code: 2024–364). Informed consent was acquired from all patients included in this study. Consent for publication: All authors had full access to all the data in the study and had final responsibility for the decision to submit for publication. Competing interests: All authors of this manuscript declare no known competing financial interests or personal relationships that could have appeared to influence the work reported in this paper.
Figures


Similar articles
-
(Epi)genotype-phenotype correlations in Beckwith-Wiedemann syndrome.Eur J Hum Genet. 2016 Feb;24(2):183-90. doi: 10.1038/ejhg.2015.88. Epub 2015 Apr 22. Eur J Hum Genet. 2016. PMID: 25898929 Free PMC article.
-
Nephrological findings and genotype-phenotype correlation in Beckwith-Wiedemann syndrome.Pediatr Nephrol. 2012 Mar;27(3):397-406. doi: 10.1007/s00467-011-2009-4. Epub 2011 Oct 21. Pediatr Nephrol. 2012. PMID: 22015620
-
Clinical and molecular features of children with Beckwith-Wiedemann syndrome in China: a single-center retrospective cohort study.Ital J Pediatr. 2020 Apr 29;46(1):55. doi: 10.1186/s13052-020-0819-3. Ital J Pediatr. 2020. PMID: 32349794 Free PMC article.
-
Beckwith-Wiedemann syndrome: Clinical, histopathological and molecular study of two Tunisian patients and review of literature.Mol Genet Genomic Med. 2021 Oct;9(10):e1796. doi: 10.1002/mgg3.1796. Epub 2021 Sep 12. Mol Genet Genomic Med. 2021. PMID: 34510813 Free PMC article. Review.
-
CDKN1C (p57(Kip2)) analysis in Beckwith-Wiedemann syndrome (BWS) patients: Genotype-phenotype correlations, novel mutations, and polymorphisms.Am J Med Genet A. 2010 Jun;152A(6):1390-7. doi: 10.1002/ajmg.a.33453. Am J Med Genet A. 2010. PMID: 20503313 Review.
References
-
- Mussa A, Di Candia S, Russo S, et al. Recommendations of the scientific committee of the Italian Beckwith-Wiedemann syndrome association on the diagnosis, management and follow-up of the syndrome. Eur J Med Genet. 2016;59:52–64. - PubMed
MeSH terms
LinkOut - more resources
Full Text Sources
Medical
