. 2025 Jun 16;44(1):175.
doi: 10.1186/s13046-025-03441-4.

PARP-1 as a novel target in endocrine-resistant breast cancer

Affiliations

PARP-1 as a novel target in endocrine-resistant breast cancer

Azzurra Zicarelli et al. J Exp Clin Cancer Res. .

Abstract

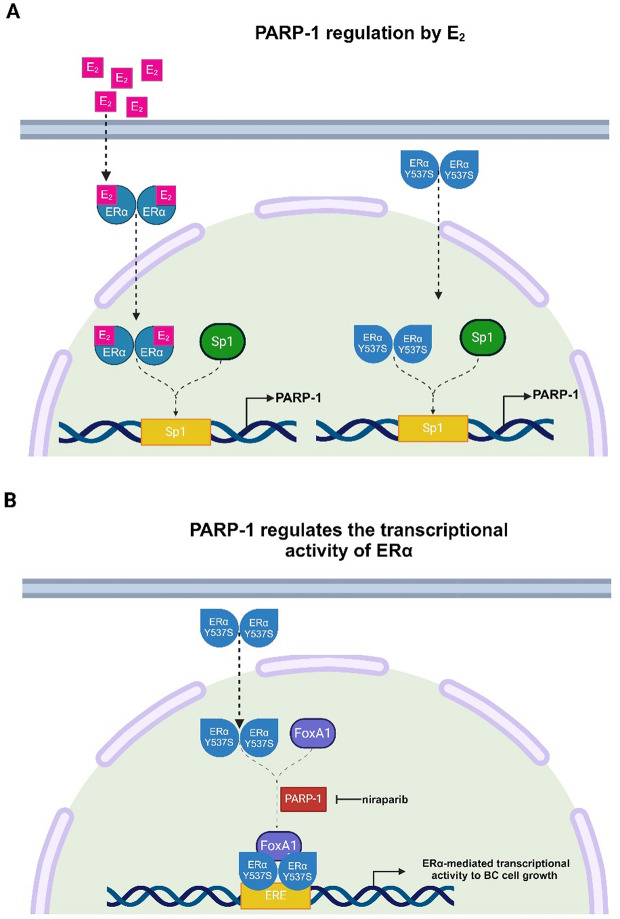
Background: Several mechanisms are involved in the resistance to endocrine therapy (ET) in estrogen receptor (ERα)-positive breast cancer (BC), including acquired mutations of ERα gene (ESR1). For example, the frequent mutation, Y537S, was shown to trigger a constitutively active receptor leading to reduced affinity for both agonist and antagonist ligands. The development of more comprehensive therapies remains a challenge in BC patients exhibiting activating mutations in ERα. Here, we show that Poly (ADP-ribose) polymerase-1 (PARP-1) may be considered as a novel therapeutic target in ERα-positive BC.

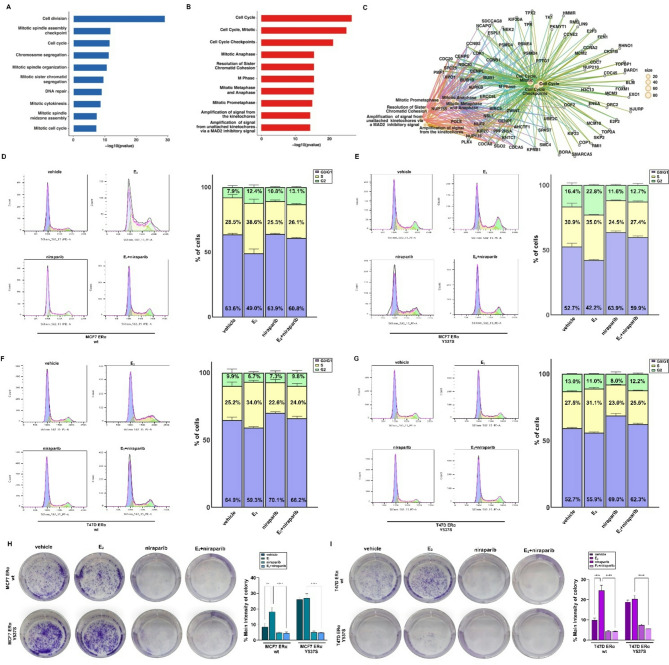
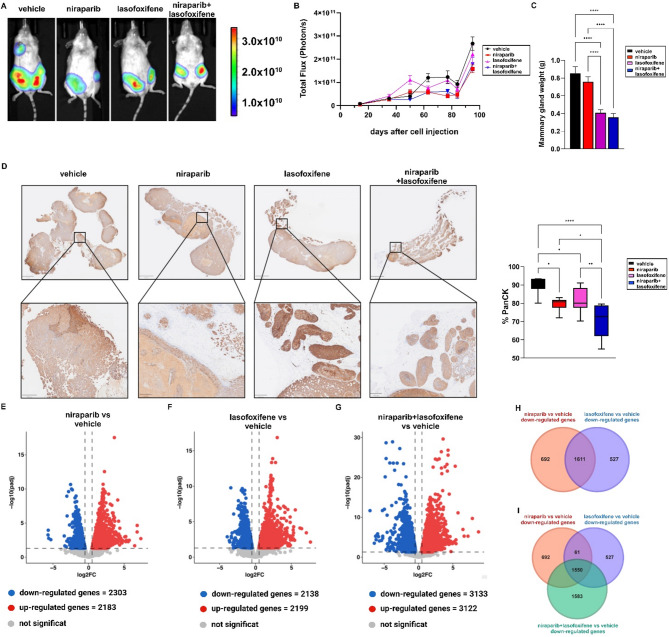
Methods: ERα wild type or Y537S mutated MCF7 and T47D BC cell lines were used as model systems. Immunoblotting, immunofluorescence, gene silencing, real-time PCR, promoter assays, chromatin immunoprecipitation sequencing (ChIP-seq) as well as cell viability, colony and cell cycle assays served to investigate the involvement of PARP-1 in BC progression. The growth of MCF7 ERα Y537S cells injected into the mammary ducts of NSG mice and treated with the ERα antagonist lasofoxifene or the PARP-1 inhibitor niraparib was monitored by luminescence imaging, weight measurement, and histological analysis. RNA sequencing studies were performed on the above-described xenograft tumors. METABRIC dataset was used to evaluate the clinical significance of PARP-1 and the biological role of the PARP-1-associated genes in ERα-positive BC patients.

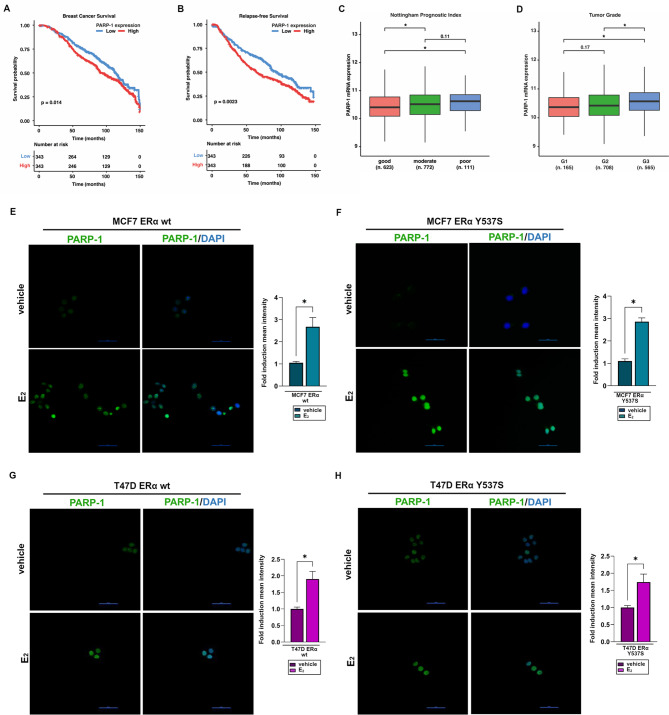
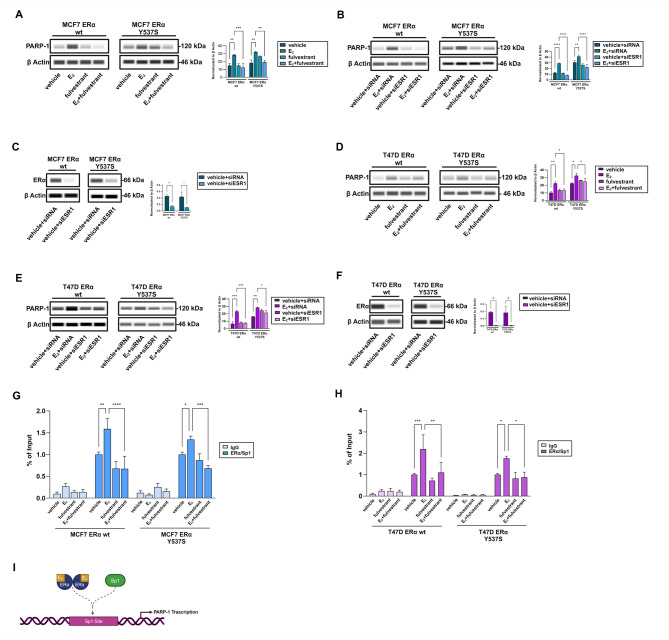
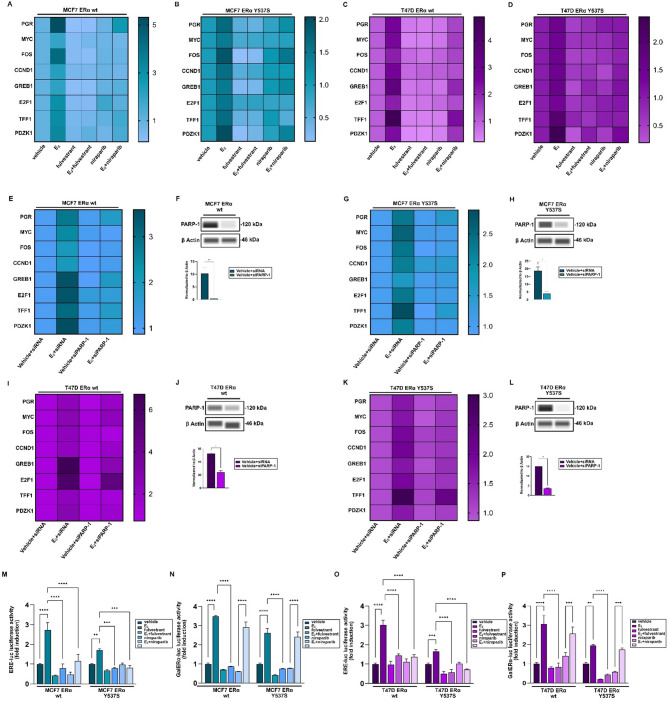
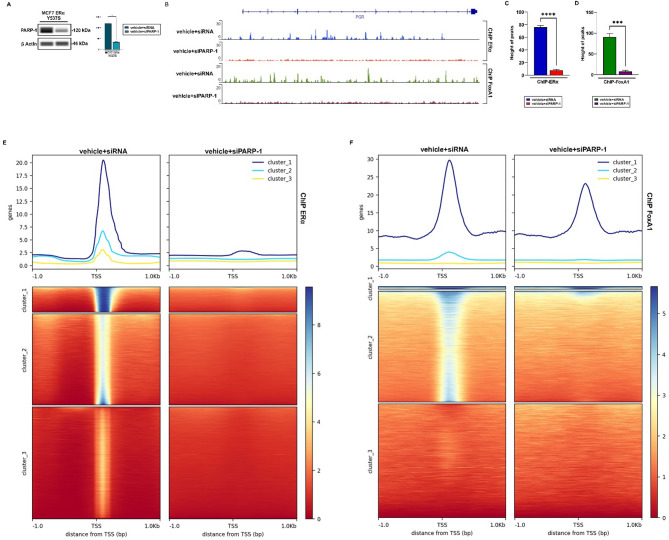
Results: We first demonstrated that the up-regulation of PARP-1 expression induced by estrogens is abrogated either by inhibiting or silencing ERα in MCF7 and T47D BC cells expressing ERα wild type or Y537S mutation. We then showed that PARP-1 is involved in the binding of ERα and its co-activator FoxA1 to the promoters of several target genes, as determined by ChIP-sequencing studies. Of note, the inhibition of PARP-1 prevented the proliferative effects mediated by ERα in BC cells expressing either wild type or Y537S ERα. In accordance with these findings, the growth of xenograft tumors derived from MCF7 ERα Y537S BC cells was significantly reduced using niraparib and lasofoxifene. Finally, RNA-sequencing analyses showed that ERα signaling is downregulated by niraparib compared to vehicle-treated tumors.

Conclusions: Overall, our results suggest that PARP-1 should be explored as a potential target in comprehensive therapeutic approaches in ET-resistant BC.

Keywords: Breast cancer; Endocrine therapy; Niraparib; PARP-1.


Conflict of interest statement

Declarations. Ethics approval and consent to participate: All procedures conformed to the Helsinki Declaration for the research on humans. Consent for publication: All the authors agree to publish this paper. Competing interests: The authors declare no competing interests.

Figures

Fig. 1
Fig. 1
PARP-1 expression correlates with poor outcomes in ERα-positive breast cancer (BC) patients and is up-regulated by estrogen in ERα-positive BC cells. Kaplan-Meier curves depicting the correlation of PARP-1 levels with breast cancer survival (A) and relapse-free survival (B) in ERα-positive BC patients in the METABRIC dataset. BC patients who died from other diseases were not included in the analyses. Box plots showing the expression levels PARP-1 in ERα-positive BC patients in the METABRIC cohort, stratified by the Nottingham Prognostic Index (C) and the tumor grade (D). The number of patients is indicated in the panels. (*) p-value < 0.001. PARP-1 expression (green signal) evaluated by immunofluorescence experiments in ERα wild type (wt) MCF7 and T47D cells (E, G) or ERα Y537S mutated cells (F, H) treated with vehicle or 10 nM 17β-estradiol (E2) for 8 h. Nuclei were stained with 4′,6-diamidino-2-phenylindole dihydrochloride (DAPI, blue signal). The images represent 10 random fields from three independent experiments. Scale bar: 50 μm. The side panels represent the fold induction of mean fluorescent intensity of PARP-1 expression in E2 respect to vehicle-treated cells, calculated on at least 10 random fields of each sample. Data represent the average of three biological replicates, error bars indicate SEM. (*) p < 0.05
Fig. 2
Fig. 2
ERα is involved in estrogen-induced expression of PARP-1. (A, D) PARP-1 expression evaluated by immunoblotting assays in ERα wild type (wt) or Y537S mutated MCF7 or T47D cells treated for 8 h with vehicle or 10 nM 17β-estradiol (E2) alone or in combination with 1µM fulvestrant. Immunoblots of PARP-1 (B, E) and ERα (C, F) levels in ERα wt or Y537S mutated MCF7 or T47D cells transfected with siRNA or siESR1 (encoding for ERα) and treated with vehicle or 10 nM E2 for 8 h, as indicated. Right panels show densitometric analysis of the blots normalized to β-Actin, which was used as a loading control. Recruitment of ERα and Sp1 to PARP-1 promoter by ChIP assay in ERα wt or Y537S mutated MCF7 (G) and T47D (H) cells. In control samples, nonspecific IgGs were used instead of the primary antibody. The amplified sequences were evaluated by real-time PCR. Data represent the average of three biological replicates with error bars indicating SEM. (I) Diagram depicting PARP-1 chromatin site assessed for ERα and Sp1 binding using chromatin immunoprecipitation (ChIP) created with Biorender.com. (*) p < 0.05; (**) p < 0.005; (***) p < 0.0005; (****) p < 0.0001
Fig. 3
Fig. 3
PARP-1 regulates the transcriptional activity of ERα in BC cells. Heatmaps of mRNA expression of main ERα target genes evaluated by real-time PCR in ERα wild type (wt) or Y537S mutated MCF7 (A-B) and T47D (C-D) cells treated for 24 h with vehicle or 10 nM E2 alone or in combination with 1µM fulvestrant or niraparib, as indicated. mRNA expression of major ERα target genes in ERα wt (E, I) and Y537S mutated (G, K) MCF7 and T47D cells. Cells were transiently transfected for 36 h with negative control (siRNA) or siPARP-1 and treated with vehicle or 10 nM 17β-estradiol (E2), as indicated. Values are normalized to human beta-2-microglobulin (B2M) endogenous control expression and shown as fold changes of mRNA expression. Efficacy of PARP-1 silencing in ERα wt (F, J) and Y537S mutated (H, L) MCF7 and T47D cells. Side panels show a densitometric analysis of the blots normalized to β Actin, which was used as a loading control. (M-P) ERα wt and Y537S mutated MCF7 and T47D cells were transfected with an ER luciferase reporter gene (ERE-luc) along with the internal transfection control Renilla Luciferase (M, O) or with Gal4 reporter gene GK1, the Gal4 fusion protein encoding the Ligand Binding Domain (LBD) of ERα (GalERα) and the internal transfection control Renilla Luciferase (N, P), and next were treated for 12 h with vehicle or 10 nM E2 in the presence or absence of 1µM fulvestrant or niraparib, as indicated. The normalized luciferase activity values of cells treated with vehicle (-) were set as 1-fold induction, upon which the activity induced by treatments was calculated. Data represent the average of three biological replicates with error bars indicating SEM. (**) p < 0.005; (***) p < 0.0005; (****) p < 0.0001
Fig. 4
Fig. 4
PARP-1 influences the DNA binding between ERα and FoxA1. (A) Efficacy of PARP-1 silencing in ERα Y537S mutated MCF7 cells. Side panel shows a densitometric analysis of the blots normalized to β-Actin, which was used as a loading control. (B) ChIP-seq analysis showing ERα and FoxA1 binding in MCF7 ERα Y537S of the PGR gene. The peaks of ChIP-seq were analyzed via IGV.org platform. Analysis of ERα (C) or FoxA1 (D) DNA binding peaks in MCF7 ERα Y537S cells transfected with siRNA or siPARP-1. Data represent the average of 3 biological replicates with error bars indicating SEM. (*) p < 0.05; (***) p < 0.0005; (****) p < 0.0001. Heat maps of global evaluation enrichment around the Transcription Start Site (TSS) in ChIP of ERα (E) or FoxA1 (F) in MCF7 ERα Y537S cells transfected for 30 h with siRNA or siPARP-1. Sequencing data was analyzed via the galaxy.org platform
Fig. 5
Fig. 5
PARP-1 is implicated in the proliferative behavior of ERα wt and Y537S mutated BC cells. (A) Bar plot displaying the ten most significant PARP-1-related biological processes resulting from gene ontology analysis, which included the top 500 genes positively correlated to PARP-1 (by Pearson correlation analysis) in ERα-positive BC patients of the METABRIC dataset. The number of genes included in each term is displayed within the bars. p-value < 0.05 was set as a significant threshold. (B) Bar plot displaying the ten most significant PARP-1‐related pathways from Reactome pathway analysis using the top 500 genes positively correlated to PARP-1 (by Pearson correlation analysis) in ERα-positive BC patients of the METABRIC dataset. The color bar gradient indicates the range of significance (BH p‐adjusted values) of each pathway. p-adjusted < 0.05 was set as a significant threshold. (C) Interrelation network representing the genes correlated to PARP-1 included in the enriched pathways previously identified through Reactome analysis. (D-G) Cell cycle analysis performed by flow cytometry assays in ERα wild type (wt) and Y537S mutated MCF7 (D-E) and T47D cells (F-G) cells treated with vehicle or 10 nM of E2 for 12 h alone or in combination with 1µM niraparib. Side panels show the percentage of cells in G0/G1, S and G2/M phases of the cell cycle. Colony formation in MCF7 (H) and T47D (I) cells expressing ERα wt or Y537S mutated exposed to vehicle or 10 nM E2 alone or in combination with 1µM niraparib. The plates were stained with Crystal Violet. After 10 days of incubation cell colonies were stained and pictures were captured by a digital camera. Colonies were counted using the program LICORbio. Data represent the average of three biological replicates with error bars indicating SEM. (**) p < 0.005; (****) p < 0.0001
Fig. 6
Fig. 6
Effects of PARP-1 and ERα inhibition on the progression of BC tumors expressing ERα Y537S mutation. (A) Representative in vivo luminescence images of mice bearing tumors expressing ERα Y537S mutated MCF7 cells at day 90 after treatment initiation. (B) Total photon flux of luminescence signals measured by in vivo imaging for tumors expressing ERα Y537S mutated MCF7 cells (n = 8). (C) The average weight of mammary glands at the time of sacrifice (n = 8 glands). (D) Representative IHC sections of PanCK staining for each treatment mice group; right box plot of PanCK % in the mammary gland determined with QuPath for Windows. Data represent the average of biological replicates with error bars indicating SEM. (*) p < 0.05; (**) p < 0.005; (****) p < 0.0001. (E) Volcano plot illustrating the differentially expressed genes (DEGs) in niraparib respect to vehicle-treated ERα Y537S MCF7-derived tumors. (F) Volcano plot showing the DEGs in lasofoxifene respect to vehicle-treated ERα Y537S MCF7-derived tumors. (G) Volcano plot illustrating the DEGs in niraparib + lasofoxifene respect to vehicle-treated ERα Y537S MCF7-derived tumors. Significantly down-regulated genes (log2FC ≤ -0.5 and padj < 0.05) are shown in blue, significantly up-regulated genes (log2FC ≥ 0.5 and padj < 0.05) are shown in red, non-significant genes are shown in grey (padj ≥ 0.05). (H) Venn diagram showing the intersection of the genes down-regulated in niraparib and lasofoxifene-treated ERα Y537S MCF7-derived tumors respect to the vehicle-treated counterpart. (I) Venn diagram showing the intersection of the genes commonly down-regulated by niraparib, lasofoxifene and niraparib + lasofoxifene respect to vehicle in ERα Y537S MCF7-derived tumors
Fig. 7
Fig. 7
Proposed mechanisms involved in the regulation of PARP-1 by E2 and ERα transcriptional activity by PARP-1. (A) E2-induced (in ERα wt BC cells) or constitutive active (in ERα Y537S mutated BC cells) ERα dimerizes, translocate into the nucleus and interacts with the Sp1 protein on specific Sp1 DNA binding sites located within the promoter region of PARP-1, toward its transcription. (B) In ERα Y537S mutated BC cells, PARP-1 is involved in the regulation of the ERα and FoxA1-mediated gene expression machinery that is associated with proliferative effects

Similar articles

References

    1. Siegel RL, Miller KD, Wagle NS, Jemal A. Cancer statistics, 2023. CA Cancer J Clin. 2023;73:17–48. - PubMed
    1. Schwartz SM. Epidemiology of Cancer. Clin Chem. 2024;70:140–9. - PubMed
    1. Hulahan TS, Angel PM. From ductal carcinoma in situ to invasive breast cancer: the prognostic value of the extracellular microenvironment. J Exp Clin Cancer Res. 2024;43:329. - PMC - PubMed
    1. Russo J, Russo IH. The role of Estrogen in the initiation of breast cancer. J Steroid Biochem Mol Biol. 2006;102:89–96. - PMC - PubMed
    1. Parida S, Sharma D. The Microbiome-Estrogen connection and breast Cancer risk. Cells. 2019;8:1642. - PMC - PubMed

MeSH terms

Substances

LinkOut - more resources