. 2025 Jun 15;23(1):285.
doi: 10.1186/s12964-025-02302-z.

Disruption of the biorhythm in gastric epithelial cell triggers inflammation in Helicobacter pylori-associated gastritis by aberrantly regulating NFIL3 via CagA activated ERK-SP1 pathway

Affiliations

Disruption of the biorhythm in gastric epithelial cell triggers inflammation in Helicobacter pylori-associated gastritis by aberrantly regulating NFIL3 via CagA activated ERK-SP1 pathway

Yongsheng Teng et al. Cell Commun Signal. .

Abstract

Helicobacter pylori (H. pylori) associated gastritis, marked by chronic gastric inflammation, heightens gastric cancer risk by fostering a malignancy-prone microenvironment. Disruption of the biorhythm contribute to the onset of various gastrointestinal disorders, such as gastric dyspepsia, gastric ulcers, and cancer. We aimed to investigate the functional roles and regulatory mechanisms of key biorhythm molecules in H. pylori associated gastritis. We investigated biorhythm gene expression in H. pylori-infected human gastric tissues and found significant impact on NFIL3 expression. Animal studies confirmed that H. pylori controls NFIL3 biorhythm. Clinical samples indicated a correlation between NFIL3 and gastritis severity, suggesting a regulatory role. Then, we found that H. pylori disrupt NFIL3 expression rhythm in gastric epithelial cells (GECs) through the CagA-activated ERK-SP1 pathway. Additionally, cytokines IL1β and TNFα enhance this disruption. RNA-seq and Gene set enrichment analysis (GSEA) indicated that NFIL3 positively regulates the inflammatory response during H. pylori infection. Our research highlights the crucial role of the biorhythm molecule NFIL3 in H. pylori associated gastritis. Modulating biorhythm molecules could be a promising therapeutic approach to manage disease progression, given their impact on gastrointestinal pathology.

Keywords: Helicobacter pylori; Biorhythm; Gastric epithelial cells; Gastritis; NFIL3.


Conflict of interest statement

Declarations. Ethics approval and consent to participate: This research was approved by the Ethical and Experimental Committee of The General Hospital of Western Theater Command and written informed consent was obtained from all patients before enrolling in the research program. Similarly, the animal experiments conducted have been approved by the Ethics Committee of the Ethical and Experimental Committee of The General Hospital of Western Theater Command. Consent for publication: All authors have read the manuscript and provided their consent for the submission. Competing interests: The authors declare no competing interests.

Figures

Fig. 1
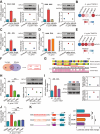
Fig. 1
The biorhythm of NFIL3 is disrupted in H. pylori-infected GECs. (A) The expression levels of biorhythm genes in human gastric mucosa were evaluated using the GEO database (GSE60427), comparing two cohorts: H. pylori-negative individuals (n = 8) and gastritis due to H. pylori infection (n = 16). (B) The mRNA expression of NFIL3 was analyzed across gastric mucosa samples from uninfected individuals (n = 8) and patients (n = 30) infected with H. pylori. (C) The presence of NFIL3 protein in the gastric mucosa was determined in both H. pylori-uninfected and infected samples through WB. (D) The mRNA expression of Nfil3 in the gastric mucosa of mice infected with H. pylori PMSS1 and uninfected controls was examined using qRT-PCR over a 24-hour light-dark cycle. (E) The protein expression of Nfil3 in the gastric mucosa of H. pylori PMSS1-infected and uninfected mice at 8 weeks post-infection (p.i.) was analyzed via WB. (F) Nfil3 protein expression in the gastric mucosa of H. pylori PMSS1-infected and uninfected mice at 8 weeks p.i. was evaluated using IHC. Scale bar: 50 μm. (G) The expression levels of biorhythm genes were evaluated in a mouse gastric epithelial progenitor-derived cell line following infection with H. pylori Kx1, utilizing data from the GEO database (GSE10262). (H) The presence of NFIL3 mRNA and protein was determined in human GECs infected with H. pylori 11,637, as well as in uninfected controls (MOI = 100, 24 h), employing qRT-PCR (n = 3) and WB. (I) NFIL3 protein expression in AGS cells infected with H. pylori 11,637 and uninfected controls (MOI = 100, 24 h) was examined using IF. (J) The expression of NFIL3 mRNA and protein in AGS cells infected with H. pylori 11,637 at varying multiplicities of infection (MOI) over a 24-hour period was analyzed through qRT-PCR (n = 3) and WB. (K) The expression levels of NFIL3 mRNA and protein in AGS cells infected with H. pylori11637 at different time intervals (MOI = 100) were assessed using qRT-PCR (n = 3) and WB. *P < 0.05, **P < 0.01, and ***P < 0.001
Fig. 2
Fig. 2
H. pylori transcriptionally increased gastric epithelial NFIL3 expression via ERK-SP1 pathway. (A) AGS cells were subjected to infection with H. pylori 11,637 or 26,695 (MOI = 100, 24 h) either in the same (lower) chamber or in a separate (upper) chamber of a Transwell apparatus. The expression levels of NFIL3 were assessed using qRT-PCR (n = 3) and WB. (B) The expression of NFIL3 in AGS cells infected with H. pylori TN2GF4 or its virulence mutant strains was evaluated through the GEO database (GSE60661). (C) NFIL3 expression was further examined in AGS cells infected with H. pylori 11,637 or the ΔcagA mutant, utilizing qRT-PCR (n = 3) and WB. (D) The expression of NFIL3 was also analyzed in AGS cells infected with H. pylori 26,695 or the ΔvacA mutant through qRT-PCR (n = 3) and WB. (E) The expression levels of NR1D1 were investigated in AGS cells infected with H. pylori TN2GF4 or virulence mutant strains utilizing the GEO database (GSE60661). (F) Potential transcription factor binding sites were predicted via the PROMO website, focusing on a 2000 bp segment of the NFIL3 promoter. (G) A conserved sequence of putative SP1 binding sites (red line) was identified in both human and mouse models. (H) WB and qRT-PCR (n = 3) analyses of NFIL3 were conducted in AGS cells post-treatment with H. pylori 11,637, U0126, and Mithramycin A (MMA). (I) Following a 24-hour transfection with SP1 siRNA, AGS cells were subsequently infected with H. pylori 11,637 for an additional 24 h. The expression levels of NFIL3 and SP1 were analyzed using qRT-PCR (n = 3) and WB. (J) NFIL3 promoter luciferase reporter assays were conducted in AGS cell lines treated with H. pylori 11,637, U0126, Mithramycin A (MMA), and the ΔcagA mutant. (K) Luciferase reporter assay for NFIL3-Luc and mutant-Luc. n.s. P > 0.05, **P < 0.01, and ***P < 0.001
Fig. 3
Fig. 3
Inflammatory cytokines from H. pylori infection exacerbate NFIL3 biorhythm disruption. (A) The expression levels of NFIL3 were evaluated in AGS cells that were stimulated with H. pylori 11,637 (MOI = 100) and/or various cytokines including IL17A, IFNγ, IL22, IL6, IL23, IL12, TGFβ, IL1β, and TNFα (100 ng/ml) for a duration of 24 h using qRT-PCR (n = 3). (B) The protein expression of NFIL3 was assessed in AGS cells subjected to stimulation with H. pylori 11,637 (MOI = 100) and/or IL1β and TNFα (100 ng/ml) over a 24-hour period via WB. (C) The expression of inflammatory cytokine genes in human gastric mucosa was examined in the GEO database (GSE60427) for the cohort diagnosed with gastritis due to H. pylori infection (n = 16). (D) The expression of inflammatory cytokine genes in human gastric mucosa was analyzed in the GEO database (GSE27411) with gastritis associated with H. pylori infection (n = 6). (E) The expression of inflammatory cytokine genes in mouse gastric mucosa was investigated in the GEO database (GSE181917) for two distinct groups: uninfected and infected with H. pylori PMSS1. (F) The mRNA expression levels of Tnf and Il1b in the gastric mucosa of mice infected with H. pylori PMSS1 and uninfected controls were quantified using qRT-PCR throughout a 24-hour light-dark cycle. (G) The expression levels of IL1R1, TNFRSF1A, and TNFRSF1B were analyzed in AGS cells infected with either H. pylori TN2GF4 or its virulence mutant strains, utilizing the GEO database (GSE60661). (H) The protein expression of p-ERK1/2 and ERK1/2 was evaluated in AGS cells stimulated with H. pylori 11,637 (MOI = 100) and/or IL1β and TNFα (100 ng/ml) for 3 h using WB. n.s. P > 0.05, *P < 0.05, **P < 0.01, and ***P < 0.001
Fig. 4
Fig. 4
NFIL3 enhances the activity of NF-κB signaling during H. pylori infection. (A) A flowchart illustrating the suppression of NFIL3 in the context of H. pylori infection. (B) Following a 24-hour transfection with NFIL3 siRNA, AGS cells were subsequently exposed to H. pylori 11,637 for an additional 24 h. The expression levels of NFIL3 were assessed using qRT-PCR (n = 3) and WB. (C) A ridge plot was generated to display the results of gene set enrichment analysis comparing H. pylori 11,637-infected NC with NC and H. pylori 11,637-infected siNFIL3 with H. pylori 11,637-infected NC based on RNA-seq. (D) An enrichment score plot for the HALLMARK sets “INFLAMMATORY_RESPONSE” and “TNFA_SIGNALING_VIA_NFKB” identified in part C. (E) A heatmap illustrating the expression levels of genes associated with the “INFLAMMATORY_RESPONSE” and “TNFA_SIGNALING_VIA_NFKB” HALLMARK sets presented in part D. **P < 0.01
Fig. 5
Fig. 5
NFIL3 regulates inflammation during H. pylori infection. (A) The volcano plot illustrates DEGs in the context of H. pylori 11,637-infected NC compared to NC, as well as H. pylori 11,637-infected siNFIL3 cells in relation to H. pylori 11,637-infected NC. IL8, IL23A, and CCL20 are highlighted. (B) The RNA-seq analysis reveals that forty-two protein-coding genes exhibited upregulation in AGS cells transfected with NC and infected with H. pylori 11,637, while these genes were downregulated in AGS cells transfected with siNFIL3 and infected with the same strain. (C) Top five GO terms of Gene-ontology analysis (cellular component, molecular function and biological process) of target genes in B. Biological process: GO:0032693, negative regulation of interleukin-10 production; GO:0030593, neutrophil chemotaxis; GO:0007263, nitric oxide mediated signal transduction; GO:1,990,266, neutrophil migration; GO:0009435, NAD biosynthetic process. Cellular component: GO:0030057, desmosome; GO:0070743 interleukin-23 complex; GO:0001536, radial spoke stalk; GO:0044304, main axon; GO:0001533, cornified envelope. Molecular function: GO:0008112, nicotinamide N-methyltransferase activity; GO:0030760, pyridine N-methyltransferase activity; GO:0008009 chemokine activity; GO:0004320, oleoyl-[acyl-carrier-protein] hydrolase activity; GO:0005153, interleukin-8 receptor binding. (D) The analysis reveals overlapping genes among the categories of “NFIL3-positive regulated genes,” “secretory protein-coding genes,” and “positive regulation of immune cell migration.” (E) The expression levels of CCL20, IL8, and IL23A were evaluated in AGS cells infected with either H. pylori TN2GF4 or virulence mutant strains, utilizing data from the GEO database (GSE60661). (F) Following a 24-hour transfection with NFIL3 siRNA, AGS cells were subsequently infected with H. pylori 11,637 for an additional 24 h. The concentrations of CCL20, IL8, and IL23A in the cell culture supernatant were quantified using ELISA. **P < 0.01 and ***P < 0.001
Fig. 6
Fig. 6
The correlation between NFIL3 and inflammation in clinical samples. (A) The mRNA expression of NFIL3 was analyzed across gastric mucosa samples from uninfected individuals (n = 8) and patients infected with H. pylori, categorized by the severity of inflammation as mild (n = 7), moderate (n = 11), and severe (n = 12). (B) NFIL3 and CCL20 correlation analysis in the GSE60427 dataset. (C) NFIL3 and IL23 correlation analysis in the GSE60427 dataset. (D) NFIL3 and IL8 correlation analysis in the GSE60427 dataset. (E) A proposed model of disruption of the biorhythm in gastric epithelial cell triggers inflammation in H. pylori-associated gastritis by aberrantly regulating NFIL3. *P < 0.05 and ***P < 0.001

Similar articles

References

    1. Rugge M, Genta RM, Malfertheiner P, Dinis-Ribeiro M, El-Serag H, Graham DY, et al. RE.GA.IN.: the Real-world gastritis Initiative-updating the updates. Gut. 2024;73(3):407–41. - PubMed
    1. Malfertheiner P, Megraud F, Rokkas T, Gisbert JP, Liou JM, Schulz C et al. Management of Helicobacter pylori infection: the Maastricht vi/florence consensus report. Gut. 2022.
    1. Li Y, Choi H, Leung K, Jiang F, Graham DY, Leung WK. Global prevalence of Helicobacter pylori infection between 1980 and 2022: a systematic review and meta-analysis. Lancet Gastroenterol Hepatol. 2023;8(6):553–64. - PubMed
    1. Zavros Y, Merchant JL. The immune microenvironment in gastric adenocarcinoma. Nat Rev Gastroenterol Hepatol. 2022;19(7):451–67. - PMC - PubMed
    1. Fox JG, Wang TC. Inflammation, atrophy, and gastric cancer. J Clin Invest. 2007;117(1):60–9. - PMC - PubMed

MeSH terms

LinkOut - more resources