

Visualizing the invisible: inner plexiform layer stratification with conventional spectral-domain optical coherence tomography
- PMID: 40518547
- PMCID: PMC12168253
- DOI: 10.1186/s40942-025-00692-3
Visualizing the invisible: inner plexiform layer stratification with conventional spectral-domain optical coherence tomography
Abstract
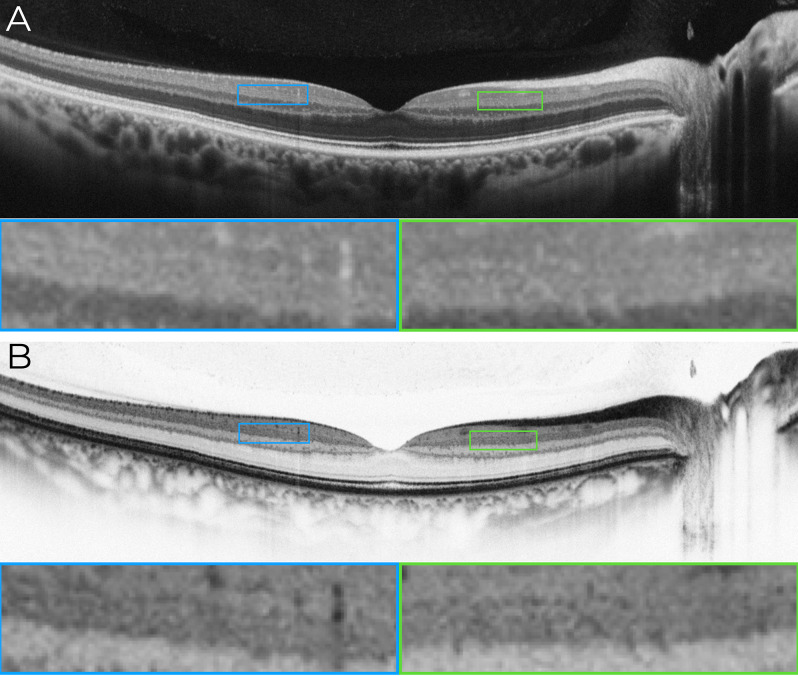
Background: The inner plexiform layer (IPL) of the retina plays a key role in visual processing, consisting of five stratified sub-bands (S1-S5) that segregate ON and OFF visual pathways. Until now, resolving these IPL sub-layers was only possible with experimental high-resolution (HR-OCT) or visible-light OCT (VIS-OCT), which remain inaccessible for clinical use. This study provides the first demonstration that IPL stratification can be visualized using commercially available spectral-domain OCT (SD-OCT) with optimized imaging and grayscale inversion.
Methods: This retrospective, cross-sectional image analysis study included three healthy individuals who underwent macular OCT imaging. Two subjects were imaged with SD-OCT devices (Nidek RS3000 Advance and Zeiss Cirrus 6000), while one subject was imaged with a swept-source OCT (SS-OCT) device (Topcon Triton DRI). High-density B-scans (1024 A-scans per B-scan) with 120 repetitions for noise reduction were analyzed in both standard and inverted grayscale display modes. The impact of scan size (12 mm, 6 mm, and 3 mm) on IPL visualization was also evaluated.
Results: In conventional grayscale, IPL stratification was indistinct. However, inverted grayscale revealed five IPL sub-bands in all cases, particularly in the parafoveal region where the IPL is thicker. Hyperreflective dots near IPL-1, likely representing the superficial capillary plexus, were also identified. The 3-mm scan protocol provided superior sub-layer differentiation compared to 12-mm scans. However, SS-OCT images did not allow for the distinction of the five IPL strata.
Conclusions: This study challenges the belief that IPL stratification cannot be identified with conventional SD-OCT. By refining imaging parameters and using grayscale inversion, this approach enhances retinal circuit analysis with standard technology. While SD-OCT enables detailed IPL visualization under specific conditions, SS-OCT does not appear to be well-suited for this purpose. These findings redefine SD-OCT's diagnostic capabilities, opening avenues for research in ophthalmology and neurodegenerative disease monitoring. Further studies should establish best practices and expand clinical applications for this novel methodology.
Keywords: Inner plexiform layer; Optical coherence tomography; Retinal imaging; Spectral-domain.
© 2025. The Author(s).
Conflict of interest statement
Declarations. Ethics approval and consent to participate: Given the retrospective nature of the study, all imaging was conducted as part of routine clinical care, with subsequent analysis done in accordance with ethical guidelines for patient confidentiality and data protection. Consent for publication: Not applicable. Generative AI and AI-assisted technologies in the writing process: During the preparation of this work the author(s) used ChatGPT in order to improve language and readability. After using this tool/service, the authors reviewed and edited the content as needed and take full responsibility for the content of the publication. Competing interests: The authors declare no competing interests.
Figures


Similar articles
-
Inner Plexiform Layer Substrata Are Discernible with Commercial OCT and Affected by Aging.Ophthalmol Sci. 2025 Apr 28;5(5):100815. doi: 10.1016/j.xops.2025.100815. eCollection 2025 Sep-Oct. Ophthalmol Sci. 2025. PMID: 40688489 Free PMC article.
-
Normative retinal thickness values in children, measured by swept-source optical coherence tomography.Med Hypothesis Discov Innov Ophthalmol. 2025 Jul 31;14(2):50-59. doi: 10.51329/mehdiophthal1523. eCollection 2025 Summer. Med Hypothesis Discov Innov Ophthalmol. 2025. PMID: 40787280 Free PMC article.
-
Regional retinal vulnerability in multiple sclerosis: integrating OCT, MRI, and clinical data for enhanced diagnosis and automated monitoring.Rom J Morphol Embryol. 2025 Jan-Mar;66(1):119-130. doi: 10.47162/RJME.66.1.11. Rom J Morphol Embryol. 2025. PMID: 40384198 Free PMC article.
-
Home treatment for mental health problems: a systematic review.Health Technol Assess. 2001;5(15):1-139. doi: 10.3310/hta5150. Health Technol Assess. 2001. PMID: 11532236
-
Eliciting adverse effects data from participants in clinical trials.Cochrane Database Syst Rev. 2018 Jan 16;1(1):MR000039. doi: 10.1002/14651858.MR000039.pub2. Cochrane Database Syst Rev. 2018. PMID: 29372930 Free PMC article.
References
-
- Leitão Guerra RL, Leitão Guerra CL, Meirelles MGB, et al. Exploring retinal conditions through blue light reflectance imaging. Prog Retin Eye Res. 2025;105:101326. 10.1016/j.preteyeres.2024.101326. - PubMed
-
- Palma CV, Amin R, Huf W et al. SPECTRAL DOMAIN-OPTICAL COHERENCE TOMOGRAPHY IMAGE CONTRAST AND BACKGROUND COLOR SETTINGS INFLUENCE IDENTIFICATION OF RETINAL STRUCTURES. http://links.lww.com/IAE/A452 - PubMed
-
- Heidelberg Engineering. State of the Art OCT: Advancing Retinal Imaging Technology. Heidelberg Engineering. 2020. Accessed January 16, 2025. https://media.heidelbergengineering.com/uploads/Products-Fachartikel/200...
LinkOut - more resources
Full Text Sources
Miscellaneous
