. 2025 Dec;14(1):2518631.
doi: 10.1080/2162402X.2025.2518631. Epub 2025 Jun 15.

Utilization of universal-targeting mSA2 CAR-T cells for the treatment of glioblastoma

Affiliations

Utilization of universal-targeting mSA2 CAR-T cells for the treatment of glioblastoma

Alexandros Kourtesakis et al. Oncoimmunology. 2025 Dec.

Abstract

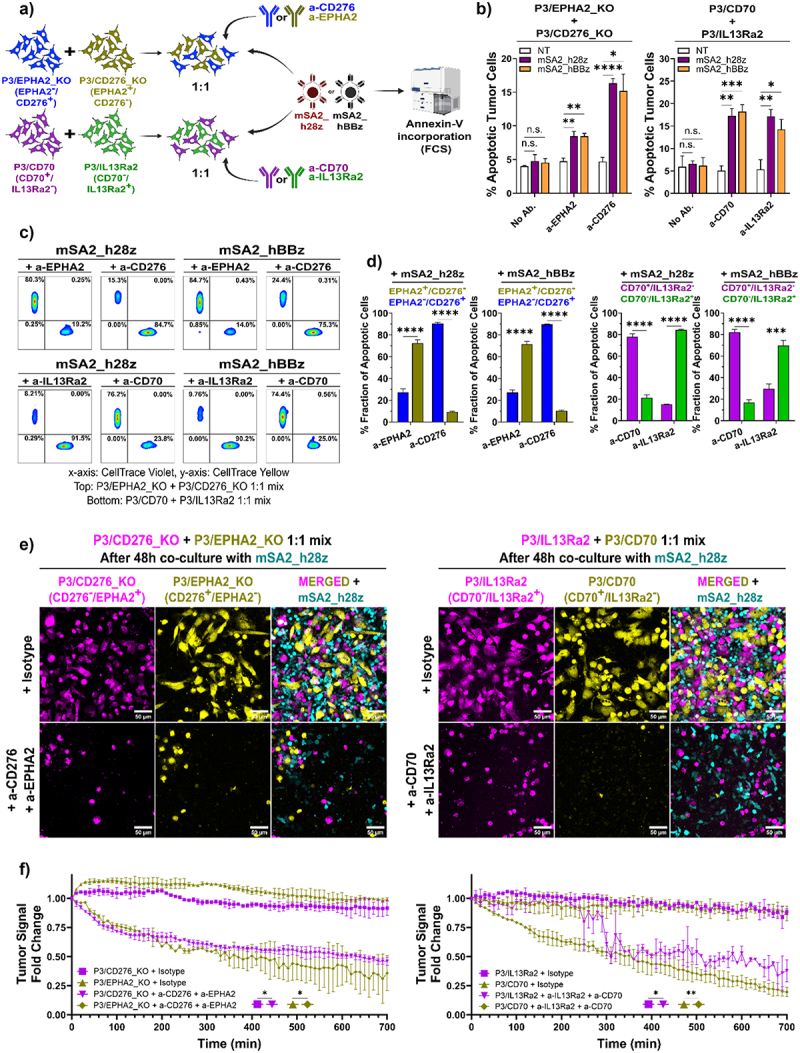
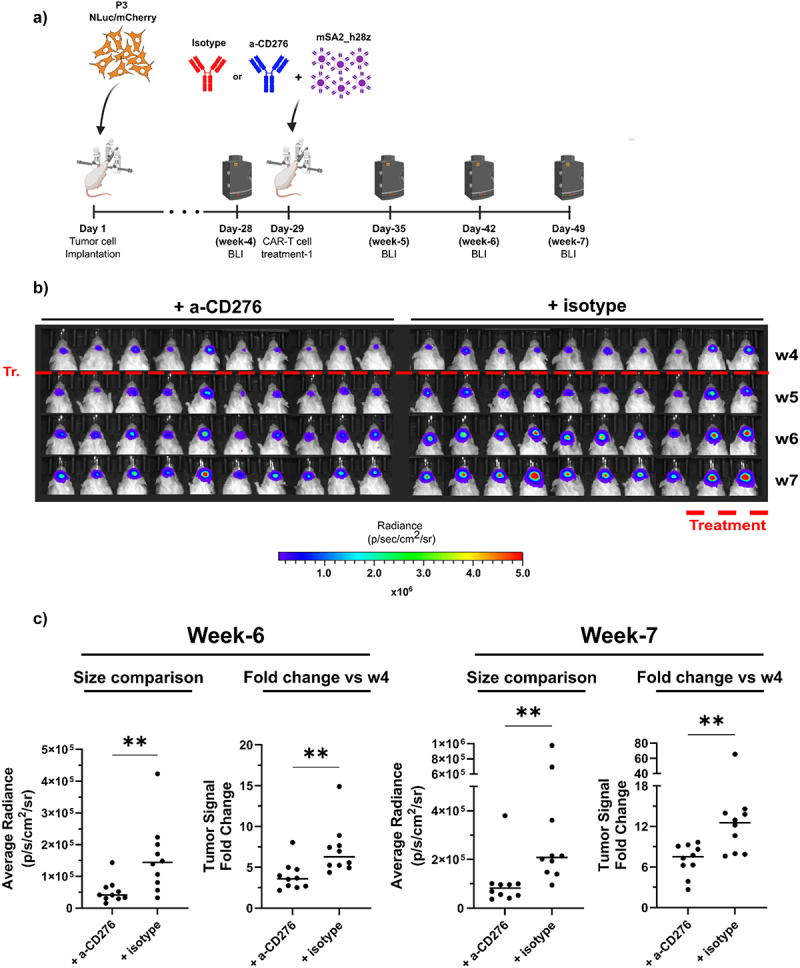
Glioblastoma (GB) remains refractory to chimeric antigen receptor (CAR)-T cell therapy, mainly attributed to tumor heterogeneity and antigen escape. CAR-T cells utilizing monomeric streptavidin-2 (mSA2) instead of a traditional target binding domain, bind biotinylated antibodies and can be directed to variable targets to mediate anti-tumor effects. Although such an approach might circumvent the aforementioned challenges, the potential of mSA2 CAR-T cells for brain tumor treatment remains unexplored. In this study, we generated mSA2 CAR-T cells and tested their efficacy against GB by tailoring their specificity toward GB-associated markers CD276, EPHA2, CD70 and IL13Ra2. In vitro, mSA2 CAR-T cells specifically recognized multiple primary GB cell lines in a target- and biotinylated antibody-dependent manner. Moreover, in heterogenous tumor environments, mSA2 CAR-T cells simultaneously targeted multiple subpopulations, guided by combinations of biotinylated antibodies, indicating their potential to address tumor heterogeneity. Finally, the mSA2 CAR-T cell-mediated anti-tumor functions were demonstrated in vivo. Immunocompromised mice orthotopically implanted with CD70+ or CD276+ GB cells and treated with mSA2 CAR-T cells pre-armed with antibodies against these two antigens exhibited control of tumor growth and induction of GB cell apoptosis after therapy. Taken together, our study suggests that antibody-guided mSA2 CAR-T cells can target potentially any surface GB-related antigen both in vitro and in vivo, either univalently or multivalently, with underlined clinical implications.

Keywords: Glioblastoma; immunotherapy; mSA2 CAR-T cells; universal antigen targeting.


Conflict of interest statement

No potential conflict of interest was reported by the author(s).

Figures

Figure 1.
Figure 1.
GB cell line screening for target selection and generation of OE and KO cell line models. (a) Expression of glioma-associated membrane antigens in primary and conventional GB cell lines by RT-qPCR. N = 2 technical replicates (two independent qPCR reactions) per gene per cell line. (b) Protein expression levels of EPHA2, CD276, IL13Ra2 and CD70 (blue histograms) in primary GB cell lines, measured by flow cytometry. (c) Evaluation of EPHA2, CD276, IL13Ra2 and CD70 protein levels (blue histograms) on the surface of generated tumor cell models by flow cytometry. For (b and c), isotype control antibodies (red histograms) were used, and data were gated on live single cells. For (b and c), indicative histograms from N = 3 biological replicates per marker per cell line and N = 3 independent experimental repeats. Results from independent experiments are shown; no data pooling was performed.
Figure 2.
Figure 2.
mSA2 CAR-T cell generation and characterization. (a) CAR construct design. (b) Transduction efficiency of primary human T-Cells, assessed by flow cytometry. The EGFP signal (blue histogram) of transduced cells is compared to the signal of NT cells (red histogram). Data gated on live single CD3+ cells. (c) Assessment of biotin-binding capacity of transduced T-Cells by flow cytometry. (d) CD8a/CD4 composition of transduced T-Cells, determined by flow cytometry. (e) CellTrace Violet dilution (blue histogram) over 5 d of steady state transduced T-cell culture, determined by flow cytometry. For (c, d and e), data were gated on live single CD3+ cells (NT) or live single CD3+/EGFP+ cells (SFG, mSA2_h28z, mSA2_hBBz). For (b, c, d and e), N = 3 biological replicates (three independent T-Cell transductions) per construct. For (b, c and d), N = 3 independent T-Cell donors. For (e), N = 2 independent T-Cell donors. Representative results from N = 2 independent repeats. Data presented as mean ± SD. Results from independent experiments are shown; no data pooling was performed.
Figure 3.
Figure 3.
In vitro evaluation of the mSA2 CAR-T cell specificity and killing potency. (a) In vitro experimental pipeline. (b) mSA2 CAR-T cell activation after co-culture with GB models, determined by flow cytometry. N = 3 biological replicates (three independent co-cultures) per group. Data gated on live single CD3+ cells (NT) or live single CD3+/EGFP+ cells (SFG, mSA2_h28z, mSA2_hBBz). An isotype control antibody was used for gating. An unpaired two-tailed student’s t-test was used to evaluate statistical significance. N = 2 independent T-Cell donors. Representative results from N = 3 independent experimental repeats. (c) Confocal IF images of P3/CD70 (CD70+/CD276+/EPHA2+) cells co-cultured with mSA2_hBBz cells. For a-EPHA2: t0 = 0 min, t1 = 140 min, t2 = 280 min, t3 = 420 min, t4 = 560 min. For a-CD276: t0 = 0 min, t1 = 220 min, t2 = 440 min, t3 = 660 min, t4 = 880 min. For a-CD70: t0 = 0 min, t1 = 350 min, t2 = 700 min, t3 = 1050 min, t4 = 1400 min. N = 2 biological replicates (two separate co-cultures) per group. N = 1 T-Cell donor. (d) Quantification of tumor cell signal from (c). A Welch’s ANOVA test with a post-hoc Dunnett T3 test for multiple comparisons was performed to assess statistical significance at the t = 560 min mark. Data presented as mean ± SD. *p < 0.05, **p < 0.01, ***p < 0.001, ****p < 0.0001; n.s., not significant. Results from independent experiments are shown; no data pooling was performed.
Figure 4.
Figure 4.
Evaluation of the mSA2 CAR-T cell specificity and efficacy in additional primary GB cell lines. (a) mSA2 CAR-T cell activation after co-culture with S24 or T269 cells, measured by flow cytometry. Data gated on live single CD3+/EGFP+ cells. A one-way ANOVA test with a post-hoc Šídák test for multiple comparisons was used. b) Confocal microscopy images after O/N co-culture of S24 cells labeled with an anti-CD276 biotinylated antibody with mSA2 CAR-T cells. Indicative photos from N = 3 biological replicate co-cultures per construct. N = 1 T-Cell donor. (c) Quantification of Annexin-V signal from (b). d) mSA2 CAR-T cell activation after co-culture with S24, P3 and T269 tumor cells, after incubation with targeting, or a non-targeting biotinylated isotype control antibody, measured by flow cytometry. Data gated on live single CD3+/EGFP+ cells. For (c and d), a one-way ANOVA test with a post-hoc Dunnett’s test for multiple comparisons was used. For (a and d), N = 3 biological replicates (three independent co-cultures) per group and N = 3 independent T-Cell donors. Indicative data from N = 2 experimental repeats. Data presented as mean ± SD. *p < 0.05, **p < 0.01, ***p < 0.001, ****p < 0.0001; n.s., not significant. Results from independent experiments are shown; no data pooling was performed.
Figure 5.
Figure 5.
Investigation of the mSA2 CAR-T cell capacity to address tumor heterogeneity in vitro. (a) Co-culture pipeline. (b) Apoptotic tumor cell fraction after co-culture with mSA2 CAR-T cells, measured by flow cytometry. Data gated on live single EGFPcells. N = 1 T-Cell donor. N = 3 biological replicates (three independent co-cultures) per group. A Welch’s ANOVA test with a post-hoc Dunnett T3 test for multiple comparisons was used for statistical significance. (c) Analysis of the Annexin-V-incorporating fraction from (b) by flow cytometry. Data gated on live single EGFP/Annexin-Vhigh tumor cells. (d) Quantification of Annexin-V incorporation from (c). (e) Confocal live cell if images of P3/CD276_KO : P3/EPHA2_KO cells (left panel) and P3/CD70 : P3/IL13Ra2 cells (right panel) after 48 h co-culture with mSA2_h28z cells, after incubation with combinations of biotinylated antibodies, or a biotinylated isotype control antibody. Indicative images from N = 2 biological replicates (two independent co-cultures) and N = 2 independent T-Cell donors per group. (f) Quantification of tumor cell signal over time from the co-culture in (e). For (d and f), an unpaired two-tailed student’s t-test was used to evaluate statistical significance. For (f), statistical significance was assessed at the t = 750 min mark. Data presented as mean ± SD. *p < 0.05, **p < 0.01, ***p < 0.001, ****p < 0.0001; n.s., not significant. Results from independent experiments are shown; no data pooling was performed.
Figure 6.
Figure 6.
Evaluation of the mSA2 CAR-T cell ability to recognize and intercept orthotopic GB tumors in vivo. (a) In vivo pipeline. (b) Quantification of tumor cell signal at the indicated time points by BLI. N = 10 mice per group. (c) Quantification of tumor cell signal from (b). Each dot represents an animal. For all comparisons, a Mann-Whitney test was used to assess significance. mSA2_h28z CAR-T cells were produced from N = 1 T-Cell donor. Data presented as mean ± SD. *p < 0.05, **p < 0.01, ***p < 0.001, ****p < 0.0001; n.s., not significant. No data pooling was performed.
Figure 7.
Figure 7.
In vivo histological investigation of the anti-GB mSA2 CAR-T cell killing functionality. (a) In vivo pipeline. (b) Evaluation of TIM-3, LAG-3 and PD-1 levels on mSA2 CAR-T cells before in vivo treatment by flow cytometry. Isotype control antibodies were used to determine gating. Data gated on live single CD3+/EGFP+ cells. (c) Tumor signal one day before and 5 days after mSA2_h28z CAR-T cell treatment, measured by BLI. N ≥ 5 animals per group. (d) Tumor signal quantification from (c). A paired t-test (mSA2_h28z, mSA2_h28z + a-CD70) and a Wilcoxon matched-pairs signed-rank test (mSA2_h28z + a-CD276) were used to assess significance. (e) Tumor signal fold-change quantification from (c). Each dot represents an animal. A one-way ANOVA test with a post-hoc Dunnett test for multiple comparisons was performed. (f) IF analysis of brains of treated animals. Representative images from two animals per treatment group. (g) Quantification of CAR-T and cleaved caspase-3 signal in stained sections from (f). Each dot represents an image from different tumor regions of a given animal. A Kruskal-Wallis test with a post-hoc Dunn’s multiple comparisons test was performed to evaluate significance. For (b and c), mSA2 CAR-T cells were produced from N = 1 T-Cell donor. Data presented as mean ± SD. *p < 0.05, **p < 0.01, ***p < 0.001, ****p < 0.0001; n.s., not significant. No data pooling was performed.
Figure 8.
Figure 8.
In vivo evaluation of the potential mSA2 CAR-T cell interaction with endogenous biotin. (a) Screening of mouse brain single cell suspensions for extracellular biotin presence by flow cytometry. Data gated on live single cells. N = 5 mice. In vitro biotinylated or non-biotinylated HEK293 cells were used as positive (blue histogram) and negative (red histogram) control samples respectively. (b) Analysis of CAR-T cell activation after co-culture of mSA2_h28z cells from N = 1 donor with the mouse brain single cell suspensions from (a) by flow cytometry. Data gated on live single CD3+/EGFP+ cells. Representative plots from N = 3 biological replicates (three independent co-cultures) per mouse. Isotype control antibodies were used to determine gating. (c) Quantification of CD137 positive signal from (b). (d) Granzyme-B and IFN-γ secretion levels in the co-culture SN from (b), determined by ELISA. For (b, c and d), P3 cells (CD276+) labeled or unlabeled with an anti-CD276 biotinylated antibody and co-cultured with mSA2_h28z cells were used as positive and negative activation control samples respectively. For (b, c and d), a one-way ANOVA test with a post-hoc Dunnett test for multiple comparisons was performed. Data presented as mean ± SD. *p < 0.05, **p < 0.01, ***p < 0.001, ****p < 0.0001; n.s., not significant; n.d., not detected. No data pooling was performed.

Similar articles

References

    1. Abramson JS, Palomba ML, Gordon LI, Lunning MA, Wang M, Arnason J, Mehta A, Purev E, Maloney DG, Andreadis C, et al. Lisocabtagene maraleucel for patients with relapsed or refractory large B-cell lymphomas (TRANSCEND NHL 001): a multicentre seamless design study. Lancet. 2020;396(10254):839–19. doi: 10.1016/S0140-6736(20)31366-0. - DOI - PubMed
    1. Berdeja JG, Madduri D, Usmani SZ, Jakubowiak A, Agha M, Cohen AD, Stewart AK, Hari P, Htut M, Lesokhin A, et al. Ciltacabtagene autoleucel, a B-cell maturation antigen-directed chimeric antigen receptor T-cell therapy in patients with relapsed or refractory multiple myeloma (CARTITUDE-1): a phase 1b/2 open-label study. Lancet. 2021;398(10297):314–324. doi: 10.1016/S0140-6736(21)00933-8. - DOI - PubMed
    1. Maude SL, Laetsch TW, Buechner J, Rives S, Boyer M, Bittencourt H, Bader P, Verneris MR, Stefanski HE, Myers GD, et al. Tisagenlecleucel in children and young adults with B-Cell lymphoblastic leukemia. N Engl J Med. 2018;378(5):439–448. doi: 10.1056/NEJMoa1709866. - DOI - PMC - PubMed
    1. Munshi NC, Anderson LD, Shah N, Madduri D, Berdeja J, Lonial S, Raje N, Lin Y, Siegel D, Oriol A, et al. Idecabtagene Vicleucel in relapsed and refractory multiple myeloma. N Engl J Med. 2021;384(8):705–716. doi: 10.1056/NEJMoa2024850. - DOI - PubMed
    1. Neelapu SS, Locke FL, Bartlett NL, Lekakis LJ, Miklos DB, Jacobson CA, Braunschweig I, Oluwole OO, Siddiqi T, Lin Y, et al. Axicabtagene ciloleucel CAR T-Cell therapy in refractory large B-Cell lymphoma. N Engl J Med. 2017;377(26):2531–2544. doi: 10.1056/NEJMoa1707447. - DOI - PMC - PubMed

Substances