. 2025 Jan-Dec:39:3946320251348715.
doi: 10.1177/03946320251348715. Epub 2025 Jun 16.

Cucurbitacin B inhibits Th17 cell differentiation via the suppression of the JAK/STAT pathway and alleviates collagen-induced arthritis in mice

Affiliations

Cucurbitacin B inhibits Th17 cell differentiation via the suppression of the JAK/STAT pathway and alleviates collagen-induced arthritis in mice

Shu-Ping Kung et al. Int J Immunopathol Pharmacol. 2025 Jan-Dec.

Abstract

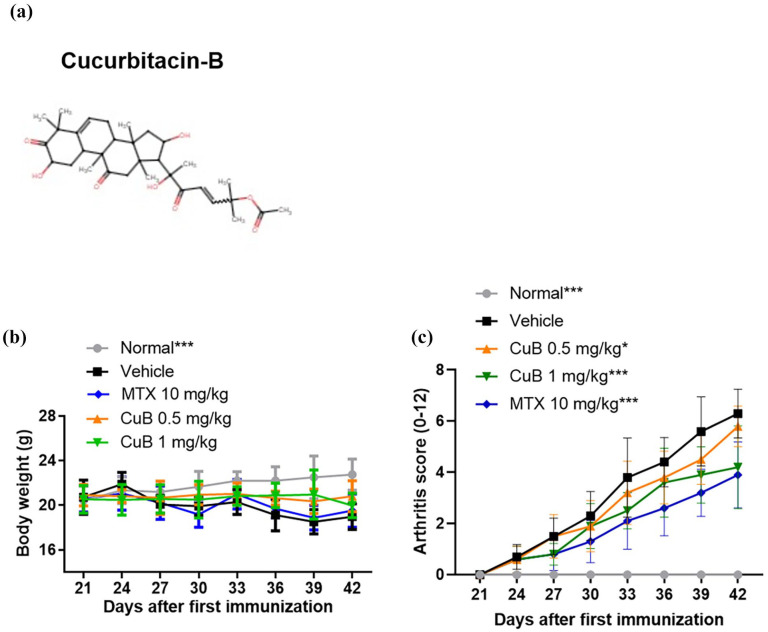
Objective: Rheumatoid arthritis (RA) is a chronic autoimmune disease with limited treatment options and associated side effects or resistance. This study aims to investigate the therapeutic potential of the natural compound cucurbitacin B (CuB) in RA treatment.

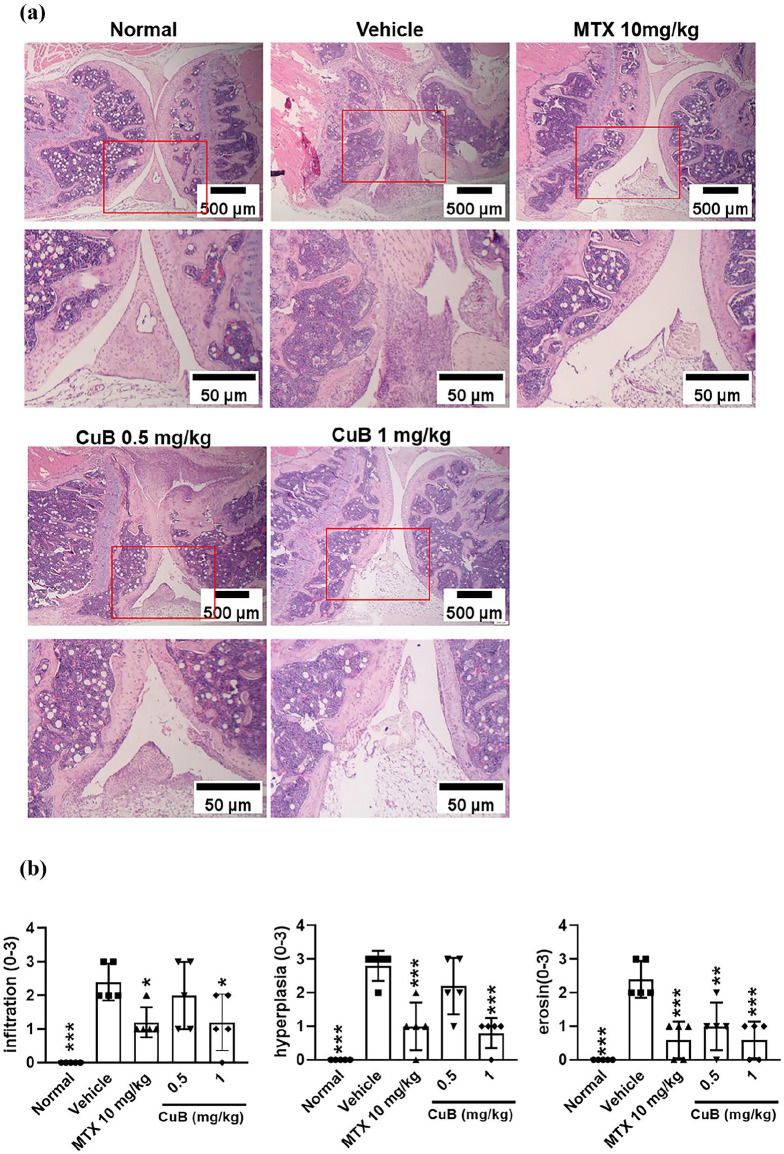
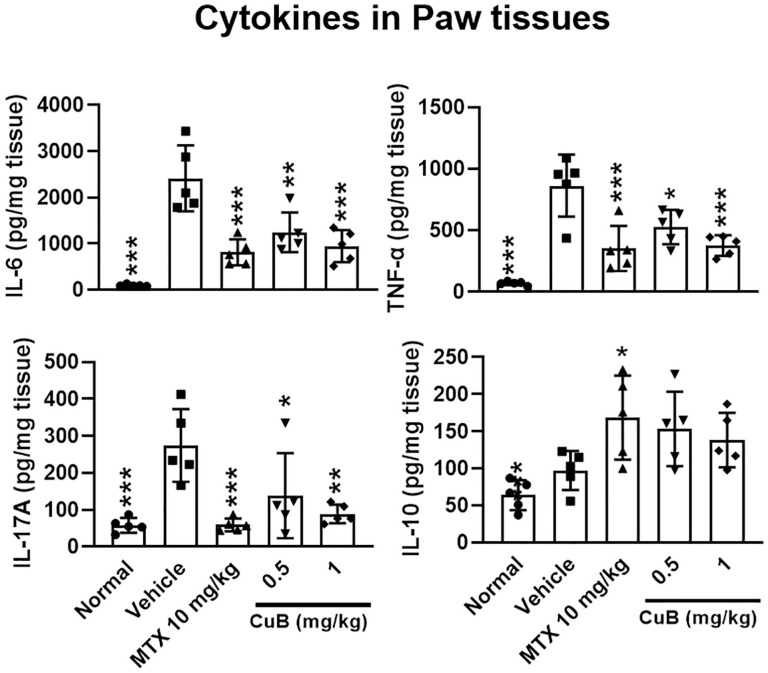
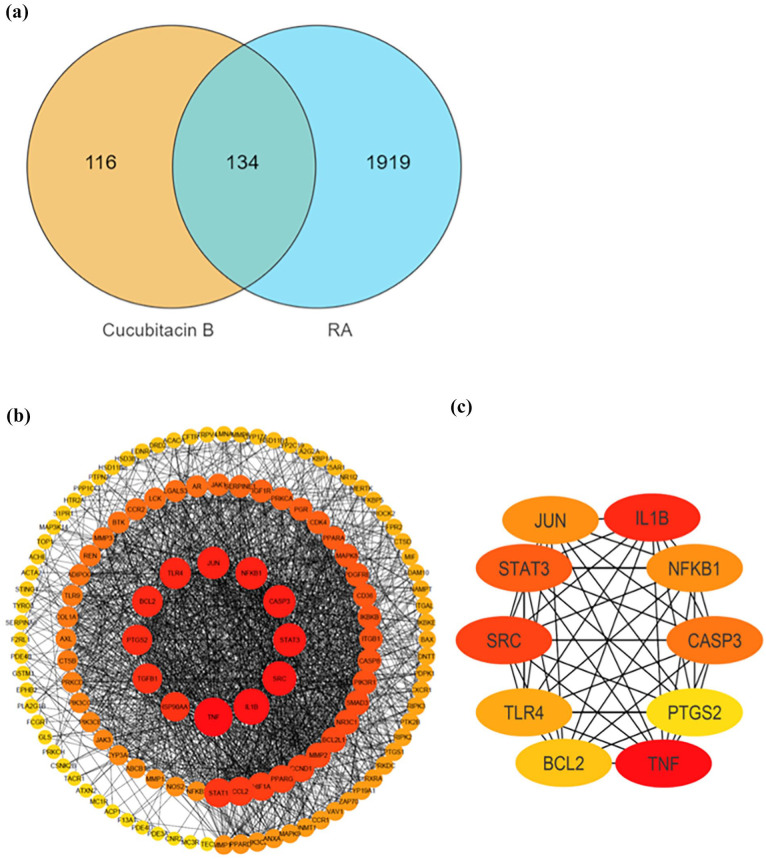
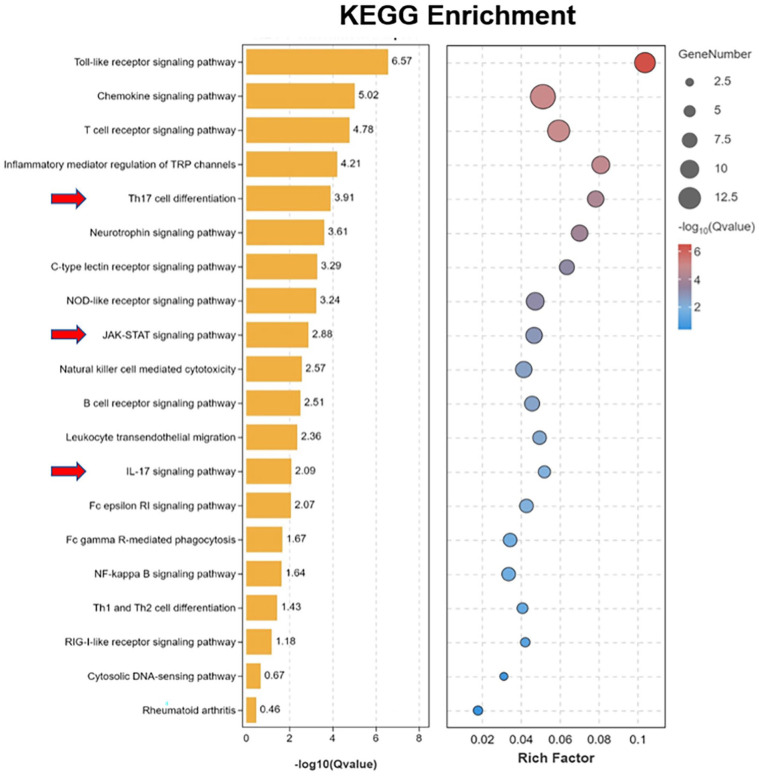
Methods: We utilized a collagen-induced arthritis (CIA) mouse model to evaluate the effects of CuB. Arthritis scores, histological damage, and pro-inflammatory cytokine expression (TNF-α, IL-17A) were assessed. In addition, network pharmacology analysis was performed to explore CuB's molecular mechanisms, focusing on Th17 cell differentiation, IL-17 signaling, and the JAK-STAT pathway.

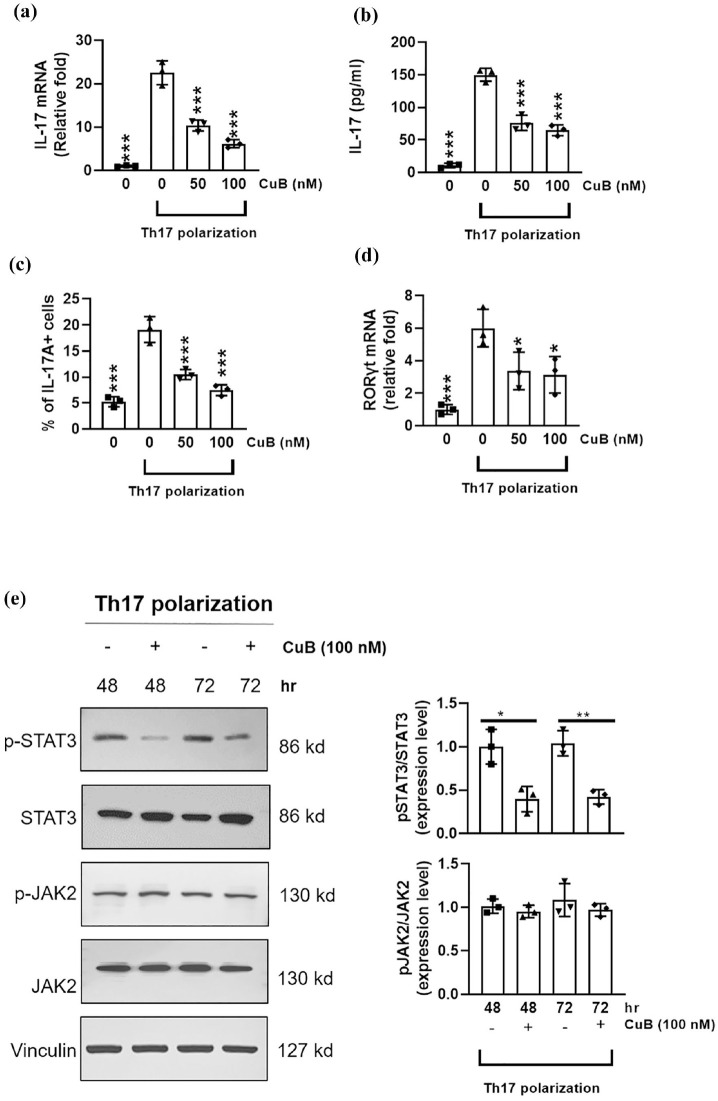
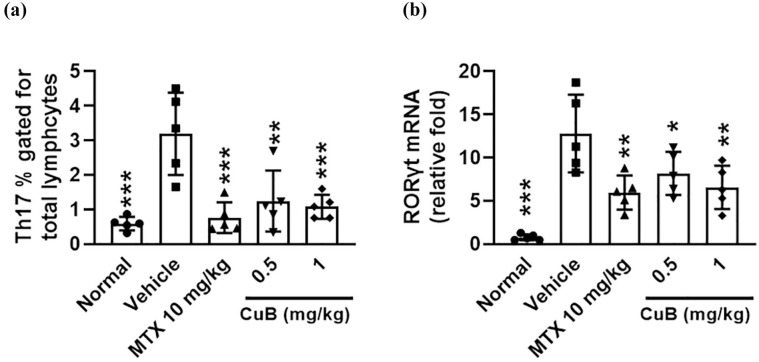
Results: CuB significantly reduced arthritis severity, decreased histological damage, and lowered the expression of pro-inflammatory cytokines in CIA mice. CuB was found to inhibit STAT3 phosphorylation and reduce the proportion of Th17 cells in the spleen, indicating its potential anti-inflammatory effects.

Conclusion: These findings suggest that cucurbitacin B may serve as a promising novel therapeutic agent for rheumatoid arthritis by targeting key inflammatory pathways.

Keywords: JAK/STAT pathway; Th17 cell differentiation; anti-inflammatory therapy; cucurbitacin B; rheumatoid arthritis (RA).


Conflict of interest statement

Declaration of conflicting interestsThe author(s) declared no potential conflicts of interest with respect to the research, authorship, and/or publication of this article.

Figures

Figure 1.
Figure 1.
Effects of cucurbitacin B on CIA symptoms in mice. (a) Chemical structure of cucurbitacin B (CuB). (b) Body weights of normal mice and CIA-induced mice treated with vehicle, methotrexate (MTX, 10 mg/kg), or CuB (0.5 mg/kg and 1 mg/kg) were monitored periodically up to day 42. (c) Arthritis scores were assessed using a visual scoring system, with higher scores indicating more severe symptoms. Each point on the graph represents the mean ± SD of ten mice. Statistical analyses were performed using two-way ANOVA followed by Tukey’s HSD post hoc test. *P < 0.05 and ***P < 0.001 versus the vehicle-treated CIA mice group.
Figure 2.
Figure 2.
Histological analysis of ankle joints in CIA-induced mice treated with cucurbitacin B. (a) Representative histological images of ankle joint sections from normal mice, CIA-induced mice treated with vehicle, and CIA-induced mice treated with methotrexate (MTX, 10 mg/kg) or cucurbitacin B (CuB) at doses of 0.5 mg/kg and 1 mg/kg. Hematoxylin and eosin staining were used to evaluate joint tissue pathology. Low-magnification images were captured at 40×, and higher-magnification images at 100×. (b) Quantitative histological scores for inflammatory cell infiltration, synovial hyperplasia, and cartilage erosion. Each bar represents the mean ± SD for five mice per group. Statistical analyses were performed using oneway ANOVA, followed by Dunnett’s post hoc test to compare each treatment group with the vehicle-treated CIA mice group. *P < 0.05, **P < 0.01, and ***P < 0.001 were considered statistically significant compared to the vehicle-treated CIA mice group.
Figure 3.
Figure 3.
Effects of cucurbitacin B on cytokine levels in paw tissues of CIA-induced mice. Levels of cytokines TNF-α, IL-6, IL-17A, and IL-10 in paw tissue homogenates were measured by ELISA on day 42 in each group, with results expressed in pg/100 mg tissue. Data are presented as means ± SD for five mice per group. Each bar represents the mean ± SD for five mice per group. Statistical analyses were performed using one-way ANOVA, followed by Dunnett’s post hoc test to compare each treatment group with the vehicle-treated CIA mice group. *P < 0.05, **P < 0.01, and ***P < 0.001 were considered statistically significant compared to the vehicle-treated CIA mice group.
Figure 4.
Figure 4.
Screening of potential gene targets for cucurbitacin B (CuB) in RA. (a) Venn diagram showing 134 common genes associated with RA and CuB. (b) Protein-protein interaction (PPI) network of the 134 shared target genes, with different colored edges representing various interaction types. (c) The top 10 key genes identified based on the “Degree” ranking, including TNF, IL1B, STAT3, and others, were visualized for further analysis.
Figure 5.
Figure 5.
KEGG pathway enrichment analysis of potential target genes associated with RA. The KEGG pathway analysis on the left displays 20 enriched immune-related pathways (P < 0.05), with the enrichment scores represented as −Log10 (Q value). Key pathways include the Toll-like receptor, Chemokine, and T cell receptor signaling pathways associated with RA pathogenesis. Notably, three pathways are highlighted explicitly due to their relevance: Th17 cell differentiation (enrichment score 3.91), JAK-STAT signaling pathway (enrichment score 2.88), and IL-17 signaling pathway (enrichment score 2.09), all of which play critical roles in modulating immune responses and inflammatory processes in RA. On the right, the bubble plot illustrates pathway enrichment scores with bubble size representing the number of genes covered by each pathway out of the 134 overlapping genes, and color intensity indicating statistical significance.
Figure 6.
Figure 6.
CuB Suppresses STAT3 Phosphorylation and Th17 Cell Differentiation. CD4+ T cells from DBA/1 mice were cultured under Th17-polarizing conditions with or without CuB (50 nM or 100 nM) for 72 hours. (a) CuB reduced IL-17 mRNA expression in a dose-dependent manner. (b) IL-17 protein levels in the culture medium decreased with increasing CuB concentration. (c) Flow cytometry showed a dose-dependent reduction in IL-17A+ Th17 cells. (d) CuB inhibited RORγt mRNA expression, a key transcription factor for Th17 differentiation, in a dose-dependent manner. (e) Western blot analysis of phosphorylated STAT3 (p-STAT3, Tyr705) and JAK2 (p-JAK2, Tyr1007/1008) in Th17-polarized CD4+ T cells treated with CuB (100 nM) for 48 and 72 hours. Vinculin was used as a loading control. Data are presented as the mean ± SD of three wells from one of three experiments. Statistical analysis for (a–d) was performed using one-way ANOVA followed by Dunnett’s post hoc test (compared to Th17-polarizing condition without CuB). Statistical significance in (e) was determined using Student’s t-test. *P < 0.05, **P < 0.01, and ***P < 0.001 versus Th17-polarizing condition without CuB treatment.
Figure 7.
Figure 7.
Cucurbitacin B (CuB) inhibits Th17 cell differentiation in the spleens of CIA mice. (a) Proportion of CD4+ IL-17A+ Th17 cells in the spleen gated from total lymphocytes in CIA mice treated with vehicle, methotrexate (MTX, 10 mg/kg), or CuB at 0.5 mg/kg and 1 mg/kg. (b) Relative mRNA expression levels of RORγt, a transcription factor critical for Th17 cell differentiation, in the spleens of CIA mice. Each bar represents the mean ± SD for five mice per group. Statistical analyses were performed using one-way ANOVA, followed by Dunnett’s post hoc test to compare each treatment group with the vehicletreated CIA mice group. *P < 0.05, **P < 0.01, and ***P < 0.001 were considered statistically significant compared to the vehicle-treated CIA mice group.

Similar articles

References

    1. Moran EM, Mullan R, McCormick J, et al. Human rheumatoid arthritis tissue production of IL-17A drives matrix and cartilage degradation: synergy with tumour necrosis factor-α, interleukin-1 and transforming growth factor-β. Arthritis Res Ther 2009; 11:R113. - PMC - PubMed
    1. Honorati MC, Meliconi R, Pulsatelli L, et al. IL-17 contributes to cartilage degradation and synovial inflammation in osteoarthritis. Osteoarthritis Cartil 2002; 10:799–807. - PubMed
    1. Jovanovic DV, Di Battista JA, Martel-Pelletier J, et al. IL-17 stimulates the production and expression of proinflammatory cytokines, IL-1β and TNF-α, by human macrophages. J Biol Chem 2003; 278:40197–40204. - PubMed
    1. Tesmer LA, Lundy SK, Sarkar S, et al. Th17 cells in human disease. Immunol Rev 2008; 223:87–113. - PMC - PubMed
    1. Lubberts E. The IL-23–IL-17 axis in inflammatory arthritis. Nat Rev Rheumatol 2015; 11:415–429. - PubMed

MeSH terms

LinkOut - more resources