. 2025 Sep;24(9):e70135.
doi: 10.1111/acel.70135. Epub 2025 Jun 16.

Chronic Cellular NAD Depletion Activates a Viral Infection-Like Interferon Response Through Mitochondrial DNA Leakage

Affiliations

Chronic Cellular NAD Depletion Activates a Viral Infection-Like Interferon Response Through Mitochondrial DNA Leakage

Claudia C S Chini et al. Aging Cell. 2025 Sep.

Abstract

Nicotinamide adenine dinucleotide (NAD) is a key coenzyme involved in energy metabolism, DNA repair, and cellular signaling. While the effects of acute NAD depletion have been better characterized, the consequences of chronic NAD deficiency remain unclear. Here, we investigated the impact of chronic NAD depletion in cultured cells by removing the availability of nicotinamide (NAM), a key precursor for NAD synthesis, from the culture media. In NIH3T3 fibroblasts, NAM depletion caused a dramatic drop in intracellular NAD levels within 2 days. Remarkably, the cells remained viable even after 7-14 days of NAM depletion, despite NAD+ levels falling to less than 10% of control conditions. This chronic NAD depletion led to distinct metabolic alterations. Mitochondrial basal respiration remained unchanged, but cells exhibited reduced spare respiratory and maximal capacities, along with significantly impaired glycolysis. Notably, NAD depletion triggered an interferon-dependent inflammatory response, resembling viral infections. This was driven by cytosolic leakage of mitochondrial DNA (mtDNA) through voltage-dependent anion channel 1 (VDAC1), which activated the cGAS-STING signaling pathway. Inhibition of VDAC oligomerization with VBIT-4, STING signaling with H-151, or mtDNA depletion blocked the upregulation of interferon genes induced by NAM depletion. Similar interferon responses triggered by NAD depletion were observed in IMR90 human fibroblasts and HS5 stromal cells. Our findings reveal a novel link between chronic NAD deficiency, VDAC-mediated mtDNA release to the cytoplasm, and the activation of the inflammatory response, providing new insight into how NAD decline affects cellular metabolic and inflammatory processes.


Conflict of interest statement

E.N.C. holds a patent on the use of CD38 inhibitors for metabolic diseases that is licensed by Elysium Health. E.N.C. is a consultant for TeneoBio, Calico, Mitobridge, and Cytokinetics. E.N.C. is on the advisory board of Eolo Pharma. E.N.C. owns stocks in TeneoBio. Research in the Chini laboratory has been conducted in compliance with the Mayo Clinic conflicts of interest policies. The other authors declare no competing interests.

Figures

FIGURE 1
FIGURE 1
Nicotinamide depletion impairs NAD+ levels and cell proliferation. NIH3T3 cells were cultured in media with nicotinamide (NAM) or without NAM (NAM Free) for varying durations. (a) NAD+ levels in NAM Free cells expressed relative to those in NAM media (n = 3). (b) Levels of NAD‐related metabolites measured after 12 days of culture in NAM and NAM Free media (n = 5). (c) NAD+ levels in cells cultured for 14 days in NAM, NAM Free, or NAM Free for 9 days followed by 5 days of recovery in NAM (Recovery, Rec) (n = 4). (d) Relative ATP levels in cells grown in NAM and NAM Free media for 11 days (n = 4). (e, f) Percentage of cell death (e) and cell cycle distribution (f) in cells grown for 7 days in NAM and NAM Free media (n = 4). (g) Growth rates of cells cultured for different time periods in NAM and NAM Free media (n = 6). (h) Cell proliferation after 7 days in NAM or NAM Free media assessed by Edu incorporation assay (n = 4) (scale bar 41.7 μm). The data are presented as mean ± SEM, with n representing the number of different experiments. p Values were calculated using unpaired two‐sided t‐tests or one‐way ANOVA. *P < 0.05, **P < 0.01, ***P < 0.001, ****P < 0.0001.
FIGURE 2
FIGURE 2
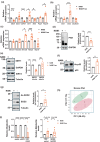
Nicotinamide depletion induces metabolic changes. NIH3T3 cells were cultured for 7–9 days in NAM or NAM Free media. (a–c) Gene expression of NAD metabolism enzymes was quantified by qPCR (n = 5–6). (d, e) Representative immunoblots of total PARylation (d) and SIRT1 and SIRT3 levels (e). Graphs show quantification (n = 5). (f, g) Representative immunoblots of Ac‐p53 and p53 (f) and Ac‐SOD2 and SOD2 (g). Graphs show quantification (n = 4–6). (h, i) Metabolomic analysis includes principal component analysis (h), and graphs show levels of some important metabolites (i) (n = 5). Data are presented as mean ± SEM, with n representing the number of different experiments. p Values were calculated using unpaired two‐sided t‐tests. *P < 0.05, **P < 0.01, ***P < 0.001, ****P < 0.0001.
FIGURE 3
FIGURE 3
Nicotinamide depletion regulates the inflammatory response in NIH3T3 cells. (a) Cells were cultured for 4–14 days in NAM or NAM Free media (n = 5–7). (b) Cells were grown for 14 days in NAM, NAM Free, or NAM Free for 9 days followed by 5 days of recovery in NAM (Recovery, Rec). (a, b) Graphs show relative gene expression assessed by qPCR (n = 7). (c) Cells were grown for 10 days in NAM, NAM Free, or NAM Free for 7 days followed by 3 days in the presence of 30 μM nicotinamide mononucleotide (NMN) or nicotinamide riboside (NR). Graphs show relative gene expression assessed by qPCR (n = 3–5). (d) Heat map shows quantitative analysis of the media from cells grown in NAM and NAM Free conditions for 7–9 days. Values are expressed relative to those in NAM media (n = 4). Data are presented as mean ± SEM with n representing the number of different experiments. p Values were calculated using unpaired two‐sided t‐tests or one‐way ANOVA. *P < 0.05, **P < 0.01, ***P < 0.001, ****P < 0.0001.
FIGURE 4
FIGURE 4
NAM depletion activates an interferon Type I response. NIH3T3 cells were cultured in NAM or NAM Free media for 12 days (n = 4). (a) Heat map shows the enrichment of the top 50 genes. (b) Circos heat map shows differentially expressed genes (DEGs). (c) Ridge plot shows the top 15 pathways altered in cells grown in NAM Free media compared to NAM media using GSEA analysis performed on gene ontology (GO) database. (d, e) Top 5 pathways ranked by GSEA analysis from the GO database (d) and cnetplot (e).
FIGURE 5
FIGURE 5
Nicotinamide depletion activates the cGAS‐STING‐interferon pathway. (a) Graph shows the relative expression of interferon‐dependent genes assessed by qPCR in cells cultured for 7 days in NAM and NAM Free media (n = 8). (b) qPCR analysis of cells treated with 15 μM cGAMP for 16 h (n = 5–6). (c, d) Representative immunoblots of cell lysates of NIH3T3 cells cultured for 9–12 days in NAM and NAM Free media. Graphs show quantification of immunoblots (n = 4). (e) Representative immunoblot and quantification of immunoblots from cell lysates of HS5 cells cultured in NAM and NAM Free media for 14 days (n = 3). Data are presented as mean ± SEM, with n representing the number of different experiments. p Values were calculated using unpaired two‐sided t‐tests. *P < 0.05, **P < 0.01, ***P < 0.001, ****P < 0.0001.
FIGURE 6
FIGURE 6
Nicotinamide depletion promotes mitochondrial dysfunction and mitochondrial dsDNA leaking to the cytosol. (a–j) NIH3T3 cells were grown for 8–14 days in NAM or NAM Free media. (a) Immunofluorescence at 8 days in media showing the presence of cytosolic dsDNA and quantification from a representative experiment (scale bar 10 μm). (b, c) After subcellular fractionation at 9 days in media, the cytosolic fraction was used to measure the amount of dsDNA (b) or to assess the presence of cytosolic DNA by qPCR (c) (n = 4). (d, e) Mitochondrial DNA copy number measured by qPCR in the mitochondrial fraction (d) and in the total fraction (e). Levels were calculated relative to 18 s in the total DNA fraction and expressed relative to NAM conditions. (f) Cells were grown for 14 days in media with and without NAM, and for 9 days in NAM Free, followed by recovery in NAM media for 5 days. Graphs show relative gene expression assessed by qPCR (n = 5–8). (g–k) Cells were cultured for 9 days in NAM and NAM Free media. (g) Immunoblotting shows levels of mitochondrial proteins VDAC1, Mitofusin‐2, and MFF and graph shows quantification (n = 4). (h) Fluorescence staining and quantification of a representative experiment with mitochondrial potential marker JC‐1 (scale bar 62.5 μm). The red fluorescence indicates the JC‐1 aggregate, while the green fluorescence indicates the JC‐1 monomer. (i–k) After culture in NAM and NAM Free media, cells were incubated in Seahorse XF media with and without 5 nM FK866 (FK). (i) Mitochondrial oxygen consumption (OCR) was measured using 1.5 μM Oligomycin (OM), 2 μM Carbonyl cyanide‐p‐trifluoromethoxyphenylhydrazone (FCCP) and 0.5 μM Rotenone/Antimycin A (ROT/AA) in the Seahorse analyzer (n = 6). (j) Glycolytic rate was measured using ROT/AA and 50 mM 2‐deoxy‐D‐glucose(2‐DG) in the Seahorse analyzer (n = 6). (k) NAD+ levels were measured from cells collected before (cells in culture media) and after addition of Seahorse XF media for 1 h (n = 3). Data are presented as mean ± SEM, with n representing the number of biological replicates. p Values were calculated using unpaired two‐sided t‐tests or one‐way ANOVA. *P < 0.05, **P < 0.01, ***P < 0.001, ****P < 0.0001.
FIGURE 7
FIGURE 7
STING, mtDNA, and VDAC regulate the inflammatory response induced by NAM depletion. (a) NIH3T3 cells were cultured in NAM and NAM Free media for 7 days. For the last 24 h, cells were treated with 0.5 μM H‐151 (STING inhibitor). Graphs show qPCR analysis (n = 4,6). (b, c) NIH3T3 cells were cultured with ethidium bromide (EtBr) to deplete mtDNA, then cultured in NAM or NAM Free media for an additional 7 days. (b) Gene expression assessed by qPCR (n = 5). (c) Mitochondrial DNA copy number measured by qPCR (n = 5). (d–f) NIH3T3 cells cultured for 8–12 days in NAM or NAM Free media were treated with or without 5 μM VBIT‐4 (VDAC inhibitor) for the last 48 h. (d) After subcellular fractionation, the cytosolic fraction was used to quantify the amount of dsDNA (n = 4). (e) Representative immunoblot and quantification of NAM Free cells cultured with and without VBIT‐4 (n = 3). (f) Expression of interferon‐dependent genes assessed by qPCR (n = 6). Data are presented as mean ± SEM, with n representing the number of different biological replicates. p Values were calculated using unpaired two‐sided t‐tests or one‐way ANOVA. *P < 0.05, **P < 0.01, ***P < 0.001, ****P < 0.0001.

References

    1. Alaee, M. , Khaghani S., Behroozfar K., Hesari Z., Ghorbanhosseini S. S., and Nourbakhsh M.. 2017. “Inhibition of Nicotinamide Phosphoribosyltransferase Induces Apoptosis in Estrogen Receptor‐Positive MCF‐7 Breast Cancer Cells.” Journal of Breast Cancer 20, no. 1: 20–26. 10.4048/jbc.2017.20.1.20. - DOI - PMC - PubMed
    1. Amjad, S. , Nisar S., Bhat A. A., et al. 2021. “Role of NAD(+) in Regulating Cellular and Metabolic Signaling Pathways.” Molecular Metabolism 49: 101195. 10.1016/j.molmet.2021.101195. - DOI - PMC - PubMed
    1. Basse, A. L. , Agerholm M., Farup J., et al. 2021. “Nampt Controls Skeletal Muscle Development by Maintaining ca(2+) Homeostasis and Mitochondrial Integrity.” Molecular Metabolism 53: 101271. 10.1016/j.molmet.2021.101271. - DOI - PMC - PubMed
    1. Basse, A. L. , Nielsen K. N., Karavaeva I., et al. 2023. “NAMPT‐Dependent NAD+ Biosynthesis Controls Circadian Metabolism in a Tissue‐Specific Manner.” Proceedings of the National Academy of Sciences of the United States of America 120, no. 14: e2220102120. 10.1073/pnas.2220102120. - DOI - PMC - PubMed
    1. Camacho‐Pereira, J. , Tarragó M. G., Chini C. C. S., et al. 2016. “CD38 Dictates Age‐Related NAD Decline and Mitochondrial Dysfunction Through an SIRT3‐Dependent Mechanism.” Cell Metabolism 23, no. 6: 1127–1139. 10.1016/j.cmet.2016.05.006. - DOI - PMC - PubMed