. 2025 Jun 16;135(12):e185119.
doi: 10.1172/JCI185119.

RSK1-driven TRIM28/E2F1 feedback loop promotes castration-resistant prostate cancer progression

Affiliations

RSK1-driven TRIM28/E2F1 feedback loop promotes castration-resistant prostate cancer progression

Miyeong Kim et al. J Clin Invest. .

Abstract

Castration-resistant prostate cancer (CRPC) marks the advanced and lethal stage of prostate cancer (PCa). TRIM28, also known as KAP1, is a transcriptional regulator recently shown to promote CRPC cell proliferation and xenograft tumor growth. Nonetheless, knowledge gaps persist regarding the mechanisms underlying TRIM28 upregulation in CRPC as well as the genomic targets regulated by TRIM28. Here, we report that TRIM28 is a E2F1 target in CRPC. Using an integrated genomic approach, we have demonstrated that TRIM28 forms a positive feedback loop to promote the transcriptional activation and genomic function of E2F1 independent of retinoblastoma (Rb) status. Furthermore, we identified RSK1 as a kinase that directly phosphorylates TRIM28 at S473, and, as such, RSK1 drives the TRIM28/E2F1 feedback loop. Accordingly, pS473-TRIM28 promotes CRPC progression, which is mitigated by RSK inhibition. In summary, our study reveals a critical role of the RSK1-TRIM28-E2F1 axis in CRPC progression, which may be exploited as a vulnerability in treating Rb-deficient CRPC.

Keywords: Cell biology; Endocrinology; Prostate cancer.


Conflict of interest statement

Conflict of interest: The authors have declared that no conflict of interest exists.

Figures

Figure 1
Figure 1. TRIM28 is an E2F1 target in advanced prostate cancer.
(AC) Tissue microarray was subjected to IHC staining with anti-TRIM28 antibody. Representative images of patient samples at different disease stages are shown: (A) BPH, (B) Gleason 7, and (C) Gleason 9. Original magnification ×4; insets ×20. (D) Quantification of TRIM28 IHC intensity scores in BPH, Gleason score < 6, 3 + 4, 4 + 3, and > 8. The y-axis shows the percentage of tumors with weak (blue), moderate (red), and intense (green) IHC scores for each category. (E) Kaplan–Meier plot depicts disease-free survival of PCa patients stratified by TRIM28-high (above median value; red) and -low expression (below median value; blue) (n = 280). Significant differences between groups was determined by 1-way ANOVA. (F and G) Genome browser tracks indicate E2F1 CUT&RUN-seq peak at the promoter region of TRIM28 loci (F). IgG and E2F1 ChIP-PCR were performed in LNCaP cells. qPCR data are shown as mean ± SEM, n = 3. Two-tailed unpaired Student’s t test, **P < 0.01. (HK) C4-2B and DU145 cells were infected by 2 shRNAs targeting E2F1. RNA was harvested for qPCR analysis of TRIM28 mRNA levels (H and I) while protein lysates were subjected to immunoblot analysis (J and K). qPCR data are shown as mean ± SEM, n = 3. Statistical analysis was performed using a 2-tailed unpaired Student’s t test, with the Holm-Bonferroni method applied to correct for multiple comparisons. **P < 0.01, ***P < 0.001. (L and M) C4-2B cells were transiently transfected with empty vector (EV) and HA-E2F1 followed by qPCR (L) and IB (M) analysis against HA and TRIM28. qPCR data are shown as mean ± SEM, n = 3. Two-tailed unpaired Student’s t test, *P < 0.05. (NP) E2F1 RNA (y-axis) was plotted against TRIM28 RNA (x-axis) using the SUC12 (n = 266) (N), TCGA (n = 492) (O), and Nat Med 2016 (n = 136) (P) datasets. x- and y-axes show normalized expression. Statistical analysis is based on linear regression.
Figure 2
Figure 2. TRIM28 regulates the E2F pathway in CRPC.
(AI) TRIM28 induces the E2F pathway. RNA-Seq was performed using RNA extracted from C4-2B with LKO and shTRIM28, respectively. GSEA enrichment plots reveal various Cancer Hallmark signatures are induced by TRIM28 (A). C4-2B (B and F), 22Rv1 (C and G), PC3 (D and H), and DU145 (E and I) cells were infected by shRNA targeting TRIM28. RNA was harvested for qPCR analysis of E2F levels (BE) while protein lysates were subjected to immunoblot analysis against TRIM28 and E2F1 (FI). qPCR data are shown as mean ± SEM, n = 3. Two-tailed unpaired Student’s t test, *P < 0.05, **P < 0.01, ***P < 0.001. (J) E2F1 and TRIM28 gene expression in prostate cell line at different stages was queried from Depmap portal and presented in a scatter plot. Statistical analysis is based on linear regression. (K and L) shRNA-resistant TRIM28 plasmids were introduced into C4-2B cells with shTRIM28. RNA was harvested for qPCR analysis of E2F levels (K) while protein lysates were subjected to immunoblot analysis against TRIM28 and E2F1 (L). qPCR data are shown as mean ± SEM, n = 3. Statistical analysis was performed using a two-tailed unpaired Student’s t test, with the Holm-Bonferroni method applied to correct for multiple comparisons. **P < 0.01, ***P < 0.001. (M and N) Overexpression of TRIM28 upregulates E2F1 expression. C4-2B cells stably expressing HA-Flag tagged TRIM28 were collected for qPCR (M) or immunoblot (N). qPCR data are shown as mean ± SEM, n = 3. Two-tailed unpaired Student’s t test, *P < 0.05, **P < 0.01, ***P < 0.001.
Figure 3
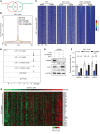
Figure 3. TRIM28 controls E2F1 genomic binding and E2F target expression in CRPC.
(AD) TRIM28 regulates E2F1 cistrome in CRPC. E2F1 CUT&RUN-seq was performed using LNCaP cells with LKO and shTRIM28. E2F1 peak was called by MACS2. Venn diagram indicates the overlapping of E2F1 binding sites for each treatment (A). Intensity plot depicts the CUT&RUN-seq peak intensity around peak center ±5 kb (B). Heatmaps indicate E2F1 CUT&RUN-seq signal at E2F1 binding sites ±2 kb (C). Genome browser tracks indicate E2F1 enrichment at the MCM3 genome in the replicates of LKO and shTRIM28. IgG CUT&RUN-seq as negative control (D). (E and F) E2F1-ChIP was performed in LNCaP cells with indicated treatment (E), and E2F1 enrichment at representative E2F targets was evaluated by qPCR (F). qPCR data are shown as mean ± SEM, n = 3. Statistical analysis was performed using a two-tailed unpaired Student’s t test, with the Holm-Bonferroni method applied to correct for multiple comparisons. *P < 0.05, **P < 0.01, ns: not significant. (G) Heatmap showing the levels of E2F-target genes in the CRPC samples from SUC12 2015 study (n = 118) sorted by TRIM28.
Figure 4
Figure 4. Phosphorylation-dependent TRIM28 transcriptional activation of E2F1.
(AC) TRIM28 directly occupies the promoter region of E2Fs. TRIM28 CUT&RUN-seq was performed in C4-2B cells. Genome browser tracks indicate TRIM28 CUT&RUN-seq peak at the promoter region of E2F1 loci (A). Pie chart depicting the genome distribution of TRIM28 binding sites (B). TRIM28 ChIP was performed in LKO and shTRIM28 KD C4-2B cells. ChIP-PCR was performed using ChIPed-DNA and normalized to input (C). qPCR data are shown as mean ± SEM, n = 3. Two-tailed unpaired Student’s t test, **P < 0.01. (DG) pS473-TRIM28 promotes transcriptional activation of its genomic targets. C4-2B and DU145 cells stably expressing HA-Flag-tagged GFP, TRIM28-WT, TRIM28-S473A, TRIM28-S473D, TRIM28-S824A, and TRIM28-S824D were treated by LKO or shTRIM28 as indicated. Four days after infection, RNA was harvested for qPCR analysis targeting E2F1 (D and F) while protein lysates were harvested for immunoblot against HA, pS473-TRIM28, pS824-TRIM28, E2F1, and GAPDH (E and G). qPCR data are shown as mean ± SEM, n = 3. Statistical analysis was performed using a 2-tailed unpaired Student’s t test, with the Holm-Bonferroni method applied to correct for multiple comparisons. *P < 0.05, **P < 0.01. (H and I) pS473-TRIM28 facilitate chromatin accessibility at E2F1 loci. ATAC-seq was performed in C4-2B cells with TRIM28-knockdown reexpressing TRIM28-WT (H) and TRIM28-S473A (I).
Figure 5
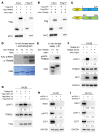
Figure 5. RSK1 directly phosphorylates TRIM28 at S473 in CRPC.
(A and B) RSK1 interacts with TRIM28 in cells. Co-IP was performed in 293T cell lysates expressing MYC-RSK1 along with HA-Flag GFP fusion (as negative control) or HA-Flag TRIM28 (A), MYC-TRIM28 along with HA-Flag GFP fusion or HA-Flag RSK1 (B) using Flag antibody. The eluted protein was analyzed by immunoblot. (CE) RSK1 phosphorylates TRIM28 at S473 in vitro. Using E.coli-expressed GST-TRIM28 fragments (F1-F2) (C), in vitro kinase assay was performed in presence of γ-32P–labelled ATP and with the use of an autoradiograph to detect protein phosphorylation (D) or in the presence of unlabeled ATP and with the use of immunoblotting to detect pS473-TRIM28 (E). (F and G) RSK1 phosphorylates TRIM28 at S473 in PCa cells. C4-2B cells transiently expressing MYC-RSK1 along with TRIM28-WT or TRIM28-S473A (F); MYC-TRIM28 along with Flag-RSK1-WT, -CA (constitutively active) and -KI (kinase-inactive) were harvested for immunoblot (G). (H and I) Protein lysates of C42B and DU145 cells with LKO and 2-independent shRSK1 were collected for immunoblot.
Figure 6
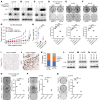
Figure 6. pS473-TRIM28 is required for CRPC progression.
(AF) pS473-TRIM28 promotes CRPC growth. LNCaP grown in hormone-depleted medium, C4-2B, and DU145 cells with the indicated treatment were harvested for immunoblot (AC) and analyzed with the colony formation assay for 7–14 days, followed by fixation and crystal violet staining (DF). Quantification was conducted by image J (colony area plugin) and presented as mean ± SEM, n = 3. Statistical analysis was performed using a 2-tailed unpaired Student’s t test, with the Holm-Bonferroni method applied to correct for multiple comparisons. **P < 0.01, ***P < 0.001. (G and H) Xenograft assay was performed by inoculating NSG mice with C4-2B LKO, TRIM28-KD, and TRIM28-KD cells rescued by TRIM28-WT and S473A mutant. (G) The tumor volume data were presented as mean ± SEM, n = 5. A 1-way ANOVA followed by post hoc multiple comparisons was used for analysis. P value adjustment was performed using Tukey’s Honest Significant Difference (HSD) test. ***P < 0.001. (H) Tumor weight data were presented as mean ± SEM, n = 5. Statistical tests performed were 2-tailed unpaired Student’s t-test, with the Holm-Bonferroni method applied to correct for multiple comparisons. *P < 0.05. (IK) Tissue microarray constructed from primary PCa and metastatic CRPC were subjected to IHC staining using anti-pS473–TRIM28 antibody. Representative images and IHC quantification of patient samples at each disease stage were shown. (LQ) RSK1 kinase activity is required for CRPC growth. Hormone-starved LNCaP, C4-2B, and DU145 cells with the indicated treatment were harvested for immunoblot (LN) and subjected to the colony formation assay for 7–14 days (OQ). Quantification was conducted by image J (colony area plugin) and presented as mean ± SEM, n = 3. Statistical analysis was performed using a 2-tailed unpaired Student’s t test, with the Holm-Bonferroni method applied to correct for multiple comparisons. *P < 0.05, **P < 0.01, ***P < 0.001.
Figure 7
Figure 7. Exploitation of the RSK1-TRIM28–E2F1 axis as a vulnerability in Rb1-deficient prostate cancer.
(A and B) C4-2B and DU145 cells treated with RSK inhibitors were analyzed by immunoblot. (C and D) C4-2B with Rb knockdown and DU145 cells treated by vehicle (Veh), 500 nM palbociclib (Pal), 1 μM BI-D1870 (BI), and 20 μM LJH685 (LJH) were subjected to the colony formation assay. Quantification was conducted by image J and presented as mean ± SEM, n = 3. Two-tailed unpaired Student’s t test, with the Holm-Bonferroni method applied to correct for multiple comparisons. **P < 0.01, ***P < 0.001. (E and F) PCa organoids were generated from prostate tumors in Pb-Cre:Pten–/– mice. (E) Representative images were shown. (F) Quantification was presented as mean ± SEM, n = 3. Two-tailed unpaired Student’s t test, with the Holm-Bonferroni method applied to correct for multiple comparisons. ***P < 0.001. (G) The experimental design of LuCaP145.1 PDX assay and treatment strategy. (HJ) NGS mice were implanted subcutaneously with LuCaP 145.1 tumors. Mice were randomized and treated with vehicle, palbociclib (75 mg/kg) and BI-D1870 (50 mg/kg) for 3 weeks. Tumor sizes were plotted against days of treatment (H). The tumor volume data were presented as mean ± SEM, n = 5. The statistical analysis was performed using a 1-way ANOVA with Tukey’s HSD test for multiple comparisons P value adjustment. ***P < 0.001. Tumor weight was presented as boxplot (I), and the toxicity was evaluated by mouse body weight (J). The data was presented as mean ± SEM, n = 5. Two-tailed unpaired Student’s t test, with the Holm-Bonferroni method applied to correct for multiple comparisons. *P < 0.05. (KN) Tumor tissues were subjected to IHC assay. Magnification ×20. (K), followed by quantification (LN). The data was presented as mean ± SEM, n = 5. Two-tailed unpaired Student’s t test, with the Holm-Bonferroni method applied to correct for multiple comparisons. ***P < 0.001.

Similar articles

References

    1. Nevins JR. Toward an understanding of the functional complexity of the E2F and retinoblastoma families. Cell Growth Differ. 1998;9(8):585–593. - PubMed
    1. Attwooll C, et al. The E2F family: specific functions and overlapping interests. EMBO J. 2004;23(24):4709–4716. doi: 10.1038/sj.emboj.7600481. - DOI - PMC - PubMed
    1. Iaquinta PJ, Lees JA. Life and death decisions by the E2F transcription factors. Curr Opin Cell Biol. 2007;19(6):649–657. doi: 10.1016/j.ceb.2007.10.006. - DOI - PMC - PubMed
    1. Han Z, et al. Differential expression of E2F transcription factors and their functional and prognostic roles in human prostate cancer. Front Cell Dev Biol. 2022;10:831329. doi: 10.3389/fcell.2022.831329. - DOI - PMC - PubMed
    1. Davis JN, et al. Elevated E2F1 inhibits transcription of the androgen receptor in metastatic hormone-resistant prostate cancer. Cancer Res. 2006;66(24):11897–11906. doi: 10.1158/0008-5472.CAN-06-2497. - DOI - PubMed

MeSH terms

Substances