. 2025 May 30:19:1612529.
doi: 10.3389/fnana.2025.1612529. eCollection 2025.

Multi-neuromeric origin of tyrosine hydroxylase-positive neurons within the substantia nigra and ventral tegmental area

Affiliations

Multi-neuromeric origin of tyrosine hydroxylase-positive neurons within the substantia nigra and ventral tegmental area

José L Ferran et al. Front Neuroanat. .

Abstract

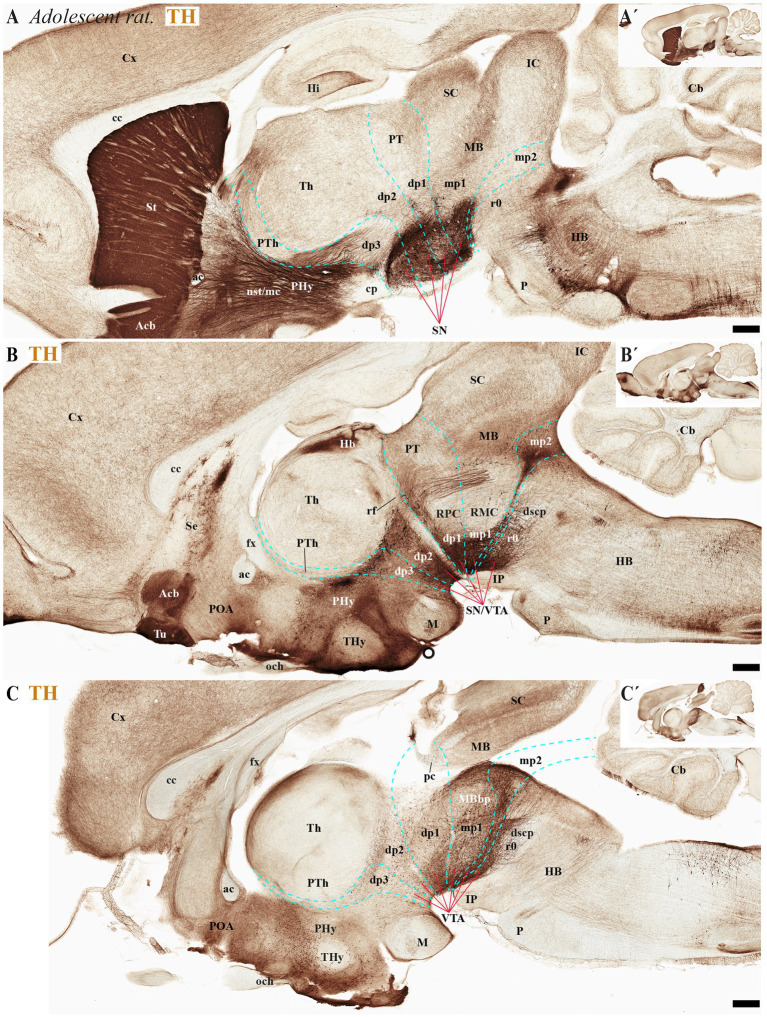
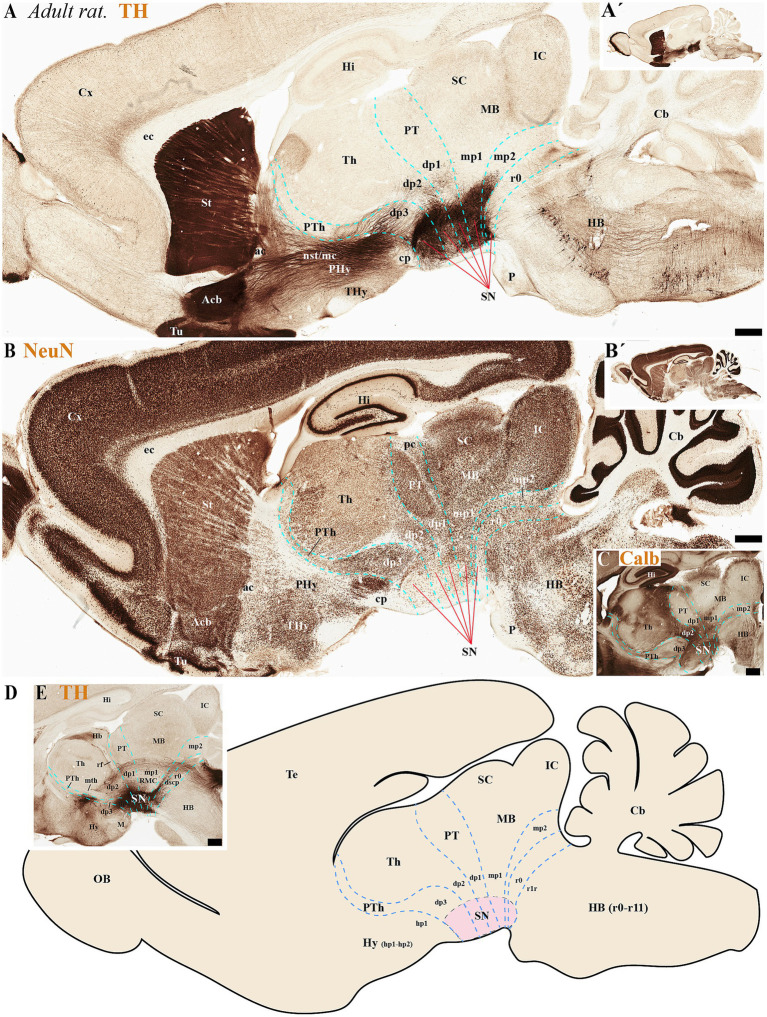
During early developmental stages, the brain is divided into three primary regions: the forebrain (prosencephalon), the hindbrain (rhombencephalon), and the spinal cord. These regions are further segmented into transverse units called neuromeres, each with distinct molecular identities that guide their specialization through development. Such modular organization is evolutionarily conserved and shapes the structural and functional complexity of the brain. The substantia nigra (SN) and ventral tegmental area (VTA) are key midbrain regions involved in reward, motivation, and motor control. They contain dopamine-producing tyrosine hydroxylase (TH)-positive neurons, which are historically classified into three anatomical groups-A8 (retrorubral field), A9 (SN pars compacta), and A10 (VTA)-each with distinct anatomical and functional properties. Recent studies revealed further sub-regional organization along medial-lateral and anterior-posterior gradients, suggesting specialized roles tied to their developmental origins. This study uses the prosomeric framework to map the segmental distribution of TH-positive neurons within the SN and VTA across different mammalian species and developmental stages. Using a comparative analysis of rodent, non-human primate and human specimens, we were able to demonstrate that TH-positive neurons within the SN and VTA exhibit a multi-neuromeric organization, with neuronal populations distributed across the diencephalic prosomeres (dp1-dp3), the midbrain prosomeres (mp1-mp2) and the isthmic rhombomere (r0). It is therefore conceivable that such multi-neuromeric origin of TH-positive neurons within the SN and VTA likely influence the patterns of connectivity and functional specialization of the dopamine system.

Keywords: SN; VTA; diencephalon; dopamine; mesomeres; nigrostriatal; prosomeres; rhombomere.


Conflict of interest statement

The authors declare that the research was conducted in the absence of any commercial or financial relationships that could be construed as a potential conflict of interest. The author(s) declared that they were an editorial board member of Frontiers, at the time of submission. This had no impact on the peer review process and the final decision.

Figures

Figure 1
Figure 1
Schematic representation of progressive anterior–posterior (AP) neural regionalization during ontogeny, as delineated by the prosomeric model. The schemas primarily illustrate midline derivatives, with later developmental stages additionally incorporating some evaginated alar plate components (see below). (A) Following neural tube closure, three molecularly distinct anteroposterior compartments—termed ‘tagmata’—emerge: the forebrain (rostral), hindbrain, and spinal (caudal). Concurrently, the neural tube undergoes dorsoventral patterning, establishing four fundamental domains: roof, alar, basal, and floor plate. The acroterminal (At) and caudal terminal (Ct) domains demarcate the junction points where the alar and basal plates converge at the rostral and caudal ends of the neural tube. The notochord, represented extending along the full rostrocaudal axis, provides key signals for floor plate specification. Pale green, pale pink and pale blue serve as color codes for identifying forebrain, hindbrain and spinal cord territories, respectively. (B) During the proneuromeric stage, the forebrain differentiates into three primary subdivisions: (1) the secondary prosencephalon (rostral), (2) the diencephalon proper, and (3) the midbrain (caudal). Meanwhile, the hindbrain is regionalized into four distinct rostrocaudal partitions: the prepontine region (PrP, most rostral), followed by the pontine (P), retropontine (RP), and medullary territories (Me, most caudal). Both roof and floor plates become morphologically distinct during this stage, with the pineal gland (PG) emerging as a roof plate derivative. The telencephalon originates via evagination from the secondary prosencephalon’s dorsal alar plate, while the superior colliculus (SC) and inferior colliculus (IC) derive from the midbrain’s (MB) alar plate. Within the At domain, two structures are identifiable: the optic chiasm (och) and neurohypohisis (NH). The color code is a continuation of the initial scheme showing all forebrain derivatives in the green range, hindbrain derivatives in the pink range, and spinal cord-related derivatives in pale blue. (C) During the neuromeric stage, the developing brain reaches its definitive segmental units. The secondary prosencephalon forms two hypothalamo-prosencephalic prosomeres (hp1 and hp2, also called peduncular hypothalamus-PHy-and terminal hypothalamus-THy-, respectively), while the diencephalon proper develops three diencephalic prosomeres (dp1–dp3). The midbrain differentiates into two prosomeres (mp1 and mp2), and the hindbrain differentiates into 13 rhombomeres (r0–r11). A/B: alar-basal boundary; Cb: Cerebellum; OB: Olfactory bulb; PT: Pretectum; PTh: Prethalamus; TG: Tectal gray; Th: Thalamus.
Figure 2
Figure 2
Schematic representation of key anatomical landmarks for identifying interneuromeric boundaries. (A) Schematic lateral view of a vertebrate mammal, with color-code identifying the derivatives from the forebrain (green range), hindbrain (pink range) and spinal cord (pale blue). (B,C) Schematic lateral view and enlargement of the brain of a vertebrate mammal (prosomeric model), showing subdivisions of the secondary forebrain (hp1, hp2), diencephalon (dp1–dp3), midbrain (mp1, mp2), and rhombomere r0. The alar plates of hp1 and hp2 are typically defined as the peduncular hypothalamus (PHy) or hypotalhamo-telencephalic prosomere 1 (hp1) and terminal hypothalamus (THy) or hypothalamo-telencephalic prosomere 2 (hp2), respectively. The dp1, dp2, and dp3 neuromeres are commonly distinguished by their major alar derivatives: the pretectum (PT), thalamus (Th), and prethalamus (PTh), respectively. The mp1 and mp2 neuromeres constitute the midbrain (MB), with the tectal gray (TG) superior colliculus (SC) and inferior colliculus (IC) arising as derivatives of mp1. Key tracts such as the optic chiasm (och), anterior commissure (ac), and fornix (fx) serve as important anatomical landmarks in the secondary prosencephalon. The fornix, which extends from the hippocampus to the mammillary body (M) and traverses the rostral part of hp1, demarcates the boundary between hp1 and hp2. From the mammillary body, two tracts arise: the mammillotegmental tract (mtg) and the mammillothalamic tract (mth). The mth projects dorsally through the basal and alar plates of dp2, passing near the rostral border of dp2 and dp3 before terminating in the anterior thalamic complex. Additionally, the habenulo-interpeduncular tract (retroflex tract) extends from the habenula to the interpeduncular nucleus in the caudal part of dp2, marking the boundary between dp1 and dp2. The dp1 prosomere contains the posterior commissure (pc), whose caudal border demarcates the dp1-midbrain boundary at the alar plate level. The parvocellular red nucleus (RPC), located in the dp1 basal plate, serves as a landmark for the rostral border of dp1, while its caudal adjacency to the magnocellular red nucleus (RMC) defines the dp1/midbrain boundary. In the midbrain basal plate, the oculomotor complex (3 N) and its nerve fibers (3n) mark the rostral midbrain limit. The trochlear nucleus (4N) and its nerve fibers (4n), the decussation of the superior cerebellar peduncle (dscp) and the interpeduncular nucleus (IP) delineate the isthmic rhombomere (r0), helping to identify the midbrain/isthmic boundary at the basal plate. Cb: Cerebellum; NH: Neurohypophysis; SC: Superior colliculus; POA: Preoptic area; Te: Telencephalon. Refer to the list for full anatomical abbreviations.
Figure 3
Figure 3
(A–I) Immunohistochemical and in situ hybridization analysis of early-stage embryonic mouse and rat brain vibratome sections. (A–C) Tyrosine hydroxylase (TH) immunostaining in three representative sagittal sections of mouse brain (lateral to medial progression). The substantia nigra (SN) and ventral tegmental area (VTA) primordia (SNp and VTAp) are undergoing differentiation and can be observed distributed across the diencephalic, midbrain and isthmic regions. Prosomeric boundaries (cyan dashed lines) are delineated using key anatomical landmarks, including the posterior commissure (pc) and retroflex tract (rf), as well as molecular markers (see gene expression patterns below). (D,I) Two representative horizontal sections (section plane indicated in panel A) demonstrate the localization of substantia nigra (SNp) and ventral tegmental area (VTAp) primordia within prosomeres dp1, dp2, and mp1. (E–G) Selected E12.5 mouse sagittal sections reveal distinct expression patterns of Gbx2, Pax6, and Lim1 mRNA. Gbx2 expression in the dp2 alar plate demarcates both its rostral border with dp3 and the caudal border with dp1. Pax6 shows strong alar plate expression in p1, where its caudal boundary defines the dp1-midbrain border. Lim1 exhibits restricted expression in the pretectal region, with: (1) its caudal boundary marking the dp1-midbrain border, and (2) its rostral expression domain in dp2 delineating the dp2-dp3 boundary (H) Representative sagittal section of rat brain at embryonic day E13.5 showing TH immunoreaction, with the ventral tegmental area primordium (VTAp) localized in the diencephalic-midbrain-isthmic region. Refer to the list for full anatomical abbreviations. Scale bar: 500 μm.
Figure 4
Figure 4
(A–C´) A lateral-to-medial series of high and low magnifications of sagittal sections from adolescent rats, processed for tyrosine hydroxylase (TH) immunohistochemistry, reveals the neuromeric distribution of substantia nigra (SN) and ventral tegmental area (VTA) dopaminergic populations. Diencephalic, midbrain, and rostral hindbrain neuromeric boundaries (cyan dashed lines) are delineated using key anatomical landmarks including the posterior commissure (pc) and retroflex tract (rf). The SN and VTA dopaminergic populations exhibit a multineuromeric distribution pattern during adolescence, spanning prosomeric domains from the diencephalon (dp1–dp3) through the midbrain (mp1-mp2) to the rostral hindbrain (r0 or isthmic rhombomere). The retroflex tract (rf) extends ventrally to the basal plate, creating a structural anteroposterior division in the SN and VTA. This separation occurs along a rostrocaudal axis, with a rostral portion located in dp2 prosomere and a caudal portion situated in dp1 prosomere (B). Refer to the list for full anatomical abbreviations. Scale bar: 500 μm.
Figure 5
Figure 5
(A–E) A series of high and low magnifications of consecutive sagittal sections from adult rats, processed for tyrosine hydroxylase (TH), NeuN, and Calb immunohistochemistry, reveals the neuromeric distribution of substantia nigra (SN) dopaminergic populations. Calbindin (Calb) immunoreactivity in the thalamus serves as a reliable molecular marker for delineating two critical neuromeric boundaries: (1) its abrupt rostral diminution marks the transition to prethalamic territories, while (2) its sharp caudal termination defines the border with pretectal domains (C). Complementing these boundaries, distinct tracts provide structural landmarks for adjacent prosomeric divisions: the retroflex tract (rf) demarcates the dp1-dp2 interface, while the posterior commissure (pc) forms a transverse fiber bundle that establishes the dp1-midbrain boundary (E). The schematic diagram presents a lateral perspective of the adult rat brain, illustrating the multineuromeric organization of the substantia nigra (SN) across three domains: (1) the diencephalon (prosomeres dp1-dp3), (2) midbrain (mesomeres mp1-mp2), and (3) isthmic region (rhombomere r0). This spatial distribution reveals how dopaminergic neuron populations maintain their embryonic compartmentalization into adulthood (D). Refer to the list for full anatomical abbreviations. Scale bar: 500 μm.
Figure 6
Figure 6
(A–C) Through analysis of consecutive sagittal sections from adult rats, positioned medial to those shown in Figure 5 and processed for tyrosine hydroxylase (TH) and NeuN immunohistochemistry, we reveal the neuromeric distribution of ventral tegmental area (VTA) dopaminergic populations. Examination at both high and low magnification demonstrates the precise organization of TH-positive neurons within specific neuromeric domains, while NeuN labeling in consecutive sections confirms their mature neuronal identity. These medial sections particularly highlight the spatial relationship of VTA dopaminergic cells with different neuromeric compartments. The schematic diagram presents a lateral perspective of the adult rat brain, illustrating the multineuromeric organization of the ventral tegmental area (VTA) (C). Refer to the list for full anatomical abbreviations. Scale bar: 500 μm.
Figure 7
Figure 7
(A–D) A lateral-to-medial series of high and low magnifications of sagittal sections from adult mice, processed for tyrosine hydroxylase (TH) immunohistochemistry, reveals the neuromeric distribution of substantia nigra (SN) and ventral tegmental area (VTA) dopaminergic populations. Three key tracts serve as anatomical landmarks for defining interprosomeric boundaries: the mamillothalamic tract (mth) (B) marks the p2/p3 boundary through its pathway connecting mammillary bodies to the anterior thalamus, retroflex tract (rf) (C) identifies the p1/p2 border via its trajectory from habenula to interpeduncular nucleus and posterior commissure (pc) (D) delineates the dp1-midbrain transition. (E) Transversal section through the midbrain region (see plane of section in D) showing the distribution of three functionally distinct brain structures: the substantia nigra compacta (SNc), substantia nigra reticular (SNr) and ventral tegmental area (VTA). Refer to the list for full anatomical abbreviations. Scale bar: 500 μm.
Figure 8
Figure 8
(A–C) Representative sagittal sections from lateral to medial planes in Macaca mulatta, along with a schematic representation, demonstrate the neuromeric organization of substantia nigra (SN) and ventral tegmental area (VTA) populations through Nissl staining. (A) The subthalamic nucleus (STh) serves as a critical anatomical landmark for identifying neuromeric boundaries in lateral sections. Its distinct position clearly demarcates the rostral termination of the substantia nigra (SN) while simultaneously defining the border between diencephalic prosomere dp3 and hypothalamic prosomere hp1. This topographical relationship remains consistent across mammalian species, making the STh an essential reference point for both developmental studies and adult neuroanatomical mapping. (B) In medial sagittal sections, three major axonal pathways serve as essential anatomical landmarks for identifying interprosomeric boundaries: the mammillothalamic tract (mth), which defines the p2/p3 boundary through its connection between mammillary bodies and anterior thalamic nuclei; the retroflex tract (rf), marking the p1/p2 border and the posterior commissure (pc), delineating the p1-mp1 transition at the diencephalic-midbrain interface. Complementary to these white matter tracts, the paired parvocellular and magnocellular red nuclei in the basal plate provide additional guidance for recognizing the p1-midbrain boundary, as does the rostral margin of the oculomotor nucleus (3N) and its emerging nerve fibers (3n). Finally, location of 4 N and decusation of superior cerebellar peduncle (dscp) help to identify the ro/midbrain boundary (C) Schematic diagram showing a lateral perspective of the adult primate Macaca Mulatta brain, illustrating the multineuromeric organization of the substantia nigra (SN). Refer to the list for full anatomical abbreviations.
Figure 9
Figure 9
(A–D) A series of representative human brain coronal sections, oriented according to the lateral schematic view (E,E´), were selected that traverse the diencephalic prosomeres dp1-dp3 and hypothalamic prosomere hp1. Consecutive sections were processed for Nissl staining–revealing cytoarchitectonic boundaries-, Cytochrome oxidase (CO) histochemistry–marking metabolic activity patterns-, Tyrosine hydroxylase (TH) immunohistochemistry–identifying dopaminergic populations-and Acetylcholinesterase (AChE) staining–delineating cholinergic pathways. The subthalamic nucleus (STh, hp1 derivative) and reticular nucleus (Rt, dp3 derivative) serve as anatomical landmarks that delineate the boundary between hypothalamic prosomere hp1 and diencephalic prosomere dp3 (C). This spatial relationship reveals a distinct portion of the substantia nigra (SN) that extends from dp3 to directly about the hp1 border (C). The parvocellular red nucleus (RPN) serves as a definitive marker for the p1 basal plate, delineating the ventral tegmental area (VTA) territory within this prosomere (C). Furthermore, the expanded thalamic nuclei reveal the alar plate organization of dp2, indicating a distinct population of substantia nigra (SN) positioned at the interface between dp1 and dp3 domains (C). The schematic lateral view of the human brain illustrates the multineuromeric organization of the substantia nigra (SN), with distinct populations distributed across diencephalic (dp1–dp3), midbrain (mp1) and isthmic (r0) prosomeres (E,E’). Refer to the list for full anatomical abbreviations. Scale bar: 500 μm.
Figure 10
Figure 10
(A–E´) A series of representative human brain coronal sections, oriented according to the lateral schematic view (E), were selected that traverse the diencephalic prosomeres dp1-dp3 and midbrain prosomere 1 (mp1). Consecutive sections were processed for Nissl staining–revealing cytoarchitectonic boundaries-, Cytochrome oxidase (CO) histochemistry–marking metabolic activity patterns-, Tyrosine hydroxylase (TH) immunohistochemistry–identifying dopaminergic populations-and Acetylcholinesterase (AChE) staining–delineating cholinergic pathways. The reticular nucleus (Rt) precisely demarcates the alar plate of diencephalic prosomere dp3 and its boundary with the thalamic alar plate (dp2). Within the dp2 alar plate, two prominent structures emerge: (1) the habenular complex (Hb) medially, and (2) the lateral geniculate nucleus (LG) positioned ventrolaterally adjacent to the optic tract (ot). In the basal plate, the parvocellular and magnocellular red nuclei serve as key landmarks for identifying the dp1 territory, containing substantia nigra (SN) populations, and the mp1 domain, harboring both SN and ventral tegmental area (VTA) neuronal groups. This organization reveals a conserved topological relationship between neuromeric boundaries and multineuromeric dopaminergic groups. The schematic lateral view of the human brain illustrates the multineuromeric organization of the substantia nigra (SN), with distinct populations distributed across diencephalic (dp1–dp3), midbrain (mp1) and isthmic (r0) prosomeres (E,E’). Refer to the list for full anatomical abbreviations. Scale bar: 500 μm.

Similar articles

References

    1. Albuixech-Crespo B., Lopez-Blanch L., Burguera D., Maeso I., Sanchez-Arrones L., Moreno-Bravo J. A., et al. (2017). Molecular regionalization of the developing amphioxus neural tube challenges major partitions of the vertebrate brain. PLoS Biol. 15:e2001573. doi: 10.1371/journal.pbio.2001573, PMID: - DOI - PMC - PubMed
    1. Beier K. T., Steinberg E. E., DeLoach K. E., Xie S., Miyamichi K., Schwarz L., et al. (2015). Circuit architecture of VTA dopamine neurons revealed by systematic input-output mapping. Cell 162, 622–634. doi: 10.1016/j.cell.2015.07.015, PMID: - DOI - PMC - PubMed
    1. Bilbao M. G., Garrigos D., Martinez-Morga M., Toval A., Kutsenko Y., Bautista R., et al. (2022). Prosomeric hypothalamic distribution of tyrosine hydroxylase positive cells in adolescent rats. Front. Neuroanat. 16:868345. doi: 10.3389/fnana.2022.868345, PMID: - DOI - PMC - PubMed
    1. Björklund A., Dunnett S. B. (2007). Dopamine neuron systems in the brain: an update. Trends Neurosci. 30, 194–202. doi: 10.1016/j.tins.2007.03.006, PMID: - DOI - PubMed
    1. Björklund A., Nobin A. (1973). Fluorescence histochemical and microspectrofluorometric mapping of dopamine and noradrenaline cell groups in the rat diencephalon. Brain Res. 51, 193–205. doi: 10.1016/0006-8993(73)90372-7, PMID: - DOI - PubMed

LinkOut - more resources