. 2025 May 30:16:1571893.
doi: 10.3389/fpls.2025.1571893. eCollection 2025.

Transcriptome and metabolome profiling reveal the chlorogenic acid as a resistance substance for rice against the white-backed planthopper Sogatella furcifera (Horváth)

Affiliations

Transcriptome and metabolome profiling reveal the chlorogenic acid as a resistance substance for rice against the white-backed planthopper Sogatella furcifera (Horváth)

Wenqi Xie et al. Front Plant Sci. .

Abstract

The white-backed planthopper (WBPH), Sogatella furcifera (Horváth) is a major migratory pest of rice, making research on rice resistance to WBPH essential for rice breeding and pest management. This study compared the resistance of susceptible rice TN1 and resistant rice KL35 to WBPH by analyzing antixenosis, antibiosis, and tolerance. We also conducted transcriptome and metabolome analysis to identify the defensive compounds against the WBPH and regulatory genes in KL35. The results indicated that KL35 exhibited significant antixenosis and tolerance to WBPH, markedly prolonging developmental duration and reducing fecundity. Metabolomic analysis identified 15 core metabolites, among which chlorogenic acid (CGA) content in KL35 was significantly higher than in TN1 both before and after WBPH feeding. Integrated transcriptomic and metabolomic analyses showed that the flavonoid biosynthetic pathway was a key anti-pest pathway in KL35. Additionally, two genes cinnamate 4-hydroxylase gene (Os05g0320700) and 4-coumarate CoA ligase (Os02g0697400) were identified and postulated as key players in the CGA biosynthesis pathway in KL35. Exogenous application of CGA to TN1 enhanced its tolerance and antixenosis to WBPH, significantly decreasing WBPH's survival and mean dry weight. These findings suggest that CGA is an important resistance substance against WBPH. As a plant-derived and environment-friendly compound, CGA could be a potentially important compound for rice WBPH resistance agriculture.

Keywords: chlorogenic acid; metabolome; resistance; rice; transcriptome; white-backed planthopper.


Conflict of interest statement

The authors declare that the research was conducted in the absence of any commercial or financial relationships that could be construed as a potential conflict of interest.

Figures

Figure 1
Figure 1
Comparison of WBPH selection profiles between KL35 and TN1. (A) nymphs, (B) adults. **, and *** represent significance p-level of 0.01, and 0.001, respectively, for differences with independent sample t-test.
Figure 2
Figure 2
Annotation of metabolites profiling with different databases. (A) Principal component analysis of all detected metabolites in both TN1 and KL35; (B) KEGG; (C) HDMB, (D) LIPID MAPS.
Figure 3
Figure 3
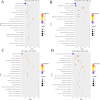
KEGG pathway analysis of differentiated DAMs between 2 lines and between 2 time points. (A) KL35 vs TN1 at 0h; (B) KL35 vs TN1 at 48h; (C) 48h vs 0h for TN1; (D) 48h vs 0h for KL35.
Figure 4
Figure 4
Heatmap of changes in core metabolites between KL35 and TN1. The x-axis represents the various treatment groups, while the y-axis represents the names of the metabolites, plotted according to their log2 fold change (log2FC) values.
Figure 5
Figure 5
Volcano plots of DEGs between 2 lines and between 2 time points. (A) KL35 vs TN1 at 0h; (B) KL35 vs TN1 at 48h; (C) 48h vs 0h for TN1; (D) 48h vs 0h for KL35, with |fold change|> 1 with padj ≤ 0.05. Up/down-regulated and no change genes are represented by red, green, and blue, respectively.
Figure 6
Figure 6
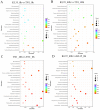
KEGG analysis within between lines for 2 time points (A, B) and each line at different time points (C, D). Enriched DEGs numbers are represented by circle size, and significance levels by color. (A) KL35 vs TN1 at 0h; (B) KL35 vs TN1 at 48h; (C) 48h vs 0h for TN1; (D) 48h vs 0h for KL35.
Figure 7
Figure 7
Integration of DAMs and DEGs from KEGG pathway analysis between 2 lines and between 2 time points. (A) KL35 vs TN1 at 0h; (B) KL35 vs TN1 at 48h; (C) 48h vs 0h for TN1; (D) 48h vs 0h for KL35. Metabolic pathways are presented along the y-axis, and the enrichment ratio by the x-axis. Analysis categories are indicated by symbol shapes. Circle for metabolomic analysis, and triangle, transcriptomic analysis. The shape size corresponds to the numbers of DEGs or DAMs with color for enrichment levels as green, yellow, and red indicating low, moderate, and high, respectively. Heatmaps were generated using log2-normalized FPKM values.
Figure 8
Figure 8
(A) Diagram of CGA biosynthesis pathway and expression of selected genes with RT-qPCR PAL, phenylalanine ammonia-lyase; C4H, cinnamate 4-hydroxylase; 4CL, 4-coumarate CoA ligase; HCT, hydroxycinnamoy-CoA shikimate/quinate hydroxycinnamoyl transferase; C3H, coumarate 3-hydroxylase; HQT, hydroxycinnamoyl-CoA quinate hydroxycinnamoyl transferase; UGCT, UDP-glucose, cinnamate glucosyltransferase; HCGQT, hydroxycinnamoyl-glucose, quinate hydroxycinnamoyltransferase. The heatmap at the left is the gene expression profile. (B) Quantitative results of RT-qPCR for CGA synthesis regulatory genes (Os02g0697400, Os05g0320700). ***, **, and ns indicate significance levels of p< 0.001, 0.01, and no significance, respectively, with independent samples t-test.
Figure 9
Figure 9
Effect of exogenous CGA by WBPH bioassay on TN1. (A) WBPH nymphs selection profiles from CGA application across time; (B) Phenotypic effect of seedling sprayed without/with 200µM CGA. (a, c) Plants sprayed with water before (a) and after (c) WBPH feeding; (b, d) plants sprayed with CGA before (b) and after (d) WBPH feeding; (C) Effect of CGA concentration by nymphs survival rate across 4 time points; (D) Effect of CGA concentration by nymphs dry weight gain at 96h after application. **, *, and ns indicate significance levels of p< 0.01, 0.05, and no significance, respectively, with independent samples t-test.

References

    1. Al-Khayri J. M., Rashmi R., Toppo V., Chole P. B., Banadka A., Sudheer W. N., et al. (2023). Plant secondary metabolites: The weapons for biotic stress management. Metabolites 13, 716. doi: 10.3390/metabo13060716 - DOI - PMC - PubMed
    1. Anand R., Divya D., Mazumdar-Leighton S., Bentur J. S., Nair S. (2023). Expression analysis reveals differentially expressed genes in BPH and WBPH associated with resistance in rice RILs derived from a cross between RP2068 and TN1. IJMS 24, 13982. doi: 10.3390/ijms241813982 - DOI - PMC - PubMed
    1. Aoki K. F., Kanehisa M. (2005). Using the KEGG database resource. Curr. Protoc. Bioinform. 11, 1.12.1-1.12.54. doi: 10.1002/0471250953.bi0112s11 - DOI - PubMed
    1. Asif S., Jang Y. H., Kim E. G., Jan R., Asaf S., Aaqil Khan M., et al. (2022). The role of exogenous gibberellic acid and methyl jasmonate against white-backed planthopper (Sogatella furcifera) stress in rice (Oryza sativa L.). Int. J. Mol. Sci. 23, 14737. doi: 10.3390/ijms232314737 - DOI - PMC - PubMed
    1. Boulesteix A. L., Strimmer K. (2006). Partial least squares: A versatile tool for the analysis of high-dimensional genomic data. Briefings Bioinf. 8, 32–44. doi: 10.1093/bib/bbl016 - DOI - PubMed

LinkOut - more resources