

Empirically Informed, Idiographic Networks of Concordant and Discordant Motives: An Experience Sampling Study With Network Analysis in Non-Clinical Participants
- PMID: 40519802
- PMCID: PMC12163690
- DOI: 10.32872/cpe.12305
Empirically Informed, Idiographic Networks of Concordant and Discordant Motives: An Experience Sampling Study With Network Analysis in Non-Clinical Participants
Abstract
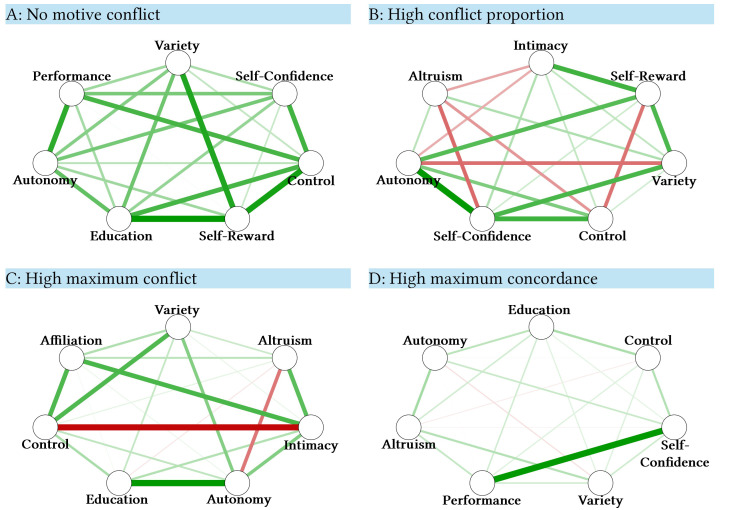
Background: Case formulations and treatment planning mostly rely on self-reports, observations, and third-party reports. We propose that these data sources can be complemented by idiographic networks of motive interactions, which are empirically derived from everyday life using the Experience Sampling Method (ESM). In these networks, positive edges represent concordance of motives whereas negative edges indicate discordance. Based on consistency theory, which states that discordance emerges when the activity of one motive (e.g., 'affiliation') is incompatible with the activity of another motive (e.g., 'autonomy'), we hypothesized that discordance would be associated with subclinical depressive symptoms.
Method: Fifty-one undergraduates completed a six-day ESM assessment period with 6 assessments of motive satisfaction per day. Based on the ESM data, idiographic networks of the seven most important motives per person were computed using mlVAR (https://doi.org/10.32614/CRAN.package.mlVAR). We extracted indices of motive dynamics from each person's network, namely the strength of negative edges compared to the overall network strength as well as the values of the single most negative and positive edges. These indices were then used to predict subclinical depressive symptoms, controlling for overall motive satisfaction.
Results: Discordant, conflicting motive relationships made up only 6% of network strengths, indicating high concordance overall. Neither conflict index predicted subclinical depressive symptoms but maximum concordance was associated with lower subclinical depressive symptoms. Motive satisfaction was a significant predictor across models.
Conclusion: The applicability and clinical utility of the motive network approach was promising. Insufficient variance due to a healthy sample and the small number of observations limit the interpretability of findings.
Keywords: approach; avoidance; concordance; conflict; consistency theory; motive.
Conflict of interest statement
We have no conflicts of interest to disclose.
Figures
References
-
- Lüdtke T., Steiner F., Berger T., Westermann S. (2025S). Supplementary materials to "Empirically informed, idiographic networks of concordant and discordant motives: An experience sampling study with network analysis in non-clinical participants" [Additional information]. PsychOpen. 10.23668/psycharchives.16213 - DOI - PMC - PubMed
-
- Antony, M. M., Bieling, P. J., Cox, B. J., Enns, M. W., & Swinson, R. P. (1998). Psychometric properties of the 42-item and 21-item versions of the Depression Anxiety Stress Scales in clinical groups and a community sample. Psychological Assessment, 10(2), 176–181. 10.1037/1040-3590.10.2.176 - DOI
-
- Arbeitskreis zur Operationalisierung Psychodynamischer Diagnostik (Ed.). (2023). OPD-3 – Operationalisierte Psychodynamische Diagnostik: Das Manual für Diagnostik und Therapieplanung (1. Auflage). Hogrefe.
-
- Beard, C., Millner, A. J., Forgeard, M. J. C., Fried, E. I., Hsu, K. J., Treadway, M. T., Leonard, C. V., Kertz, S. J., & Björgvinsson, T. (2016). Network analysis of depression and anxiety symptom relationships in a psychiatric sample. Psychological Medicine, 46(16), 3359–3369. 10.1017/S0033291716002300 - DOI - PMC - PubMed
LinkOut - more resources
Full Text Sources