. 2025 May 30:16:1578208.
doi: 10.3389/fimmu.2025.1578208. eCollection 2025.

Markers of T cell activation and exhaustion in plasma are associated with persistent symptoms up to 18 months following mild SARS-CoV-2 infection

Affiliations

Markers of T cell activation and exhaustion in plasma are associated with persistent symptoms up to 18 months following mild SARS-CoV-2 infection

Thor Ueland et al. Front Immunol. .

Abstract

Background: Persistent symptoms following SARS-CoV-2 is an increasing problem after COVID-19 disease. The pathogenesis of this persistent post Covid-19 Condition (PCC) is, however, largely unknown. We hypothesized that persistent T cell activation and exhaustion play a role in PCC development.

Methods: We examined plasma levels of soluble (s) CD25, TIM-3 and LAG-3, all markers of T cell activation/exhaustion, by enzyme immunoassays in 170 home-isolated and 53 hospitalized patients for up to 18 months after COVID-19 in relation to persistent symptomatology.

Results: Our major findings were: (i) Cases with persistent dyspnea and fatigue had markedly higher sCD25 at 6-18 months with a more modest increase in sTIM-3. (ii) Cases with memory problems at 12-18 months had increased sLAG-3 iii) sCD25 correlated with SARS-CoV-2 antibody titers and microneutralization titers only in cases with PCC while sTIM-3 correlated with these parameters irrespectively of symptoms. iv) Although hospitalized patients had markedly elevated levels of T cell activation/exhausting markers during follow-up, there was no relation to PCC symptoms.

Conclusion: Our study indicates a role for T cell activation/exhaustion in PCC following home isolated COVID-19 infection, with somewhat different patterns of sCD25, sTIM-3 and sLAG-3, but not in hospitalized COVID-19 patients where disease severity may be more important.

Keywords: SARS-CoV-2; T cell activation and exhaustion; long-term follow-up; mild covid-19 infection; persistent symptoms; post-covid condition.


Conflict of interest statement

The authors declare that the research was conducted in the absence of any commercial or financial relationships that could be construed as a potential conflict of interest. The author(s) declared that they were an editorial board member of Frontiers, at the time of submission. This had no impact on the peer review process and the final decision

Figures

Figure 1
Figure 1
T cell activation markers in home-isolated COVID-19 cases during long-term follow-up in relation to persisting symptoms. (A) prevalence of symptoms at 6, 12 and 18 (x-axis) months after infection. Numbers at the top reflect the percentage of patients with symptoms at each time-point. Tukey plots showing plasma levels of (B) soluble (s)CD25 (C) T-cell immunoglobulin and mucin domain 3 (sTIM-3) and (D) Lymphocyte-activation gene 3 (sLAG-3) in relation to symptoms at 6, 12 and 18 months after infection. *p<0.05, **p<0.01 vs. no symptoms. Data were analyzed by multivariate GLM adjusted for age, sex and comorbidities.
Figure 2
Figure 2
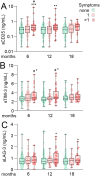
T cell activation markers during long-term follow-up in home-isolated COVID-19 cases in relation to composite scores of persisting symptoms. Tukey plots showing plasma levels (A) soluble (s)CD25 (B) T-cell immunoglobulin and mucin domain 3 (sTIM-3) and (C) Lymphocyte-activation gene 3 (sLAG-3) in relation to composite scores of symptoms at 6, 12 and 18 months after infection. Cases were grouped as having no symptoms (green), one symptom (of dyspnea, fatigue, memory problems or impaired concentration, lighter red) or two or more symptoms (darker red). *p<0.05, **p<0.01 vs. no symptoms; #p<0.05 vs. one symptom. Number of observation for 0/1/>1 symptoms was 96/49/25 at 6 months, 90/47/33 at 12 months and 64/31/22 at 18 months. Data were analyzed by multivariate GLM adjusted for age, sex and comorbidities. ***p<0.001.
Figure 3
Figure 3
Associations between T cell activation/exhaustion markers, antibody titers and T cell clonal response. (A) Heatmap showing correlations between sCD25 and sTIM-3 and IgG spike and microneutralization titers and TCRβ SARS-CoV-2 spike specific and non-spike specific CD4+ and CD8+ T cell clonal depth and breadth at different time-points during follow-up in all home-isolated COVID-19 cases (All: in all patients) and in relation to having (S+) or not having any symptom (S-) at the same time-points. For correlations at 2 months, 6-month symptoms were used. Spearman correlation coefficients are included for significant correlations. Selected correlations plots at 12 months reflecting main findings for (B) sCD25 showing positive correlation with IgG spike and microneutralization titers in cases with symptoms and (C) sTIM-3 showing positive correlations with IgG spike titers irrespective of symptom burden and SARS-CoV-2 spike specific CD4+ clonal breadth in participants without symptoms. *p<0.05, **p<0.01.
Figure 4
Figure 4
T cell activation markers during long-term follow-up in relation to persisting symptoms in mild and severe COVID-19 disease. (A) Plasma levels of soluble (s)CD25, T-cell immunoglobulin and mucin domain 3 (sTim-3) and Lymphocyte-activation gene 3 (sLAG-3) during 18 months of follow-up following mild (home-isolated COVID-19 cases) or severe (hospitalized patients) COVID-19 disease. Data are shown as estimated marginal means with 95% CI. Written p-values reflect the group (underscored) and group*time effect from the linear mixed model analysis. *p<0.05, **p<0.01, p<0.001, ***p<0.001 vs. mild disease. (B) prevalence of symptoms 6 months after infection in individuals who had mild (darker green) or severe (darker red) COVID-19 disease. (C) Plasma levels of T cell activation markers at 6 months of follow-up following severe (hospitalized patients) COVID-19 disease in relation to having symptoms or not. Data were analyzed by multivariate GLM. All analysis were adjusted for age, sex and comorbidities.

References

    1. World Health Organization . WHO Coronavirus (COVID-19) dashboard (2023). Available online at: https://data.who.int/dashboards/covid19/.data.who.int (Accessed March 2025).
    1. Chen C, Haupert SR, Zimmermann L, Shi X, Fritsche LG, Mukherjee B. Global prevalence of post-coronavirus disease 2019 (COVID-19) condition or long COVID: A meta-analysis and systematic review. J Infect Dis. (2022) 226:1593–607. doi: 10.1093/infdis/jiac136 - DOI - PMC - PubMed
    1. Taquet M, Geddes JR, Husain M, Luciano S, Harrison PJ. 6-month neurological and psychiatric outcomes in 236 379 survivors of COVID-19: a retrospective cohort study using electronic health records. Lancet Psychiatry. (2021) 8:416–27. doi: 10.1016/S2215-0366(21)00084-5 - DOI - PMC - PubMed
    1. Tsilingiris D, Vallianou NG, Karampela I, Christodoulatos GS, Papavasileiou G, Petropoulou D, et al. Laboratory findings and biomarkers in long COVID: what do we know so far? Insights into epidemiology, pathogenesis, therapeutic perspectives and challenges. Int J Mol Sci. (2023) 24(13):10458. doi: 10.3390/ijms241310458 - DOI - PMC - PubMed
    1. Davis HE, McCorkell L, Vogel JM, Topol EJ. Long COVID: major findings, mechanisms and recommendations. Nat Rev Microbiol. (2023) 21:133–46. doi: 10.1038/s41579-022-00846-2 - DOI - PMC - PubMed

Substances