Single-cell transcriptome profiling reveals dynamic cell populations and immune infiltration in cerebral cavernous malformation
- PMID: 40519934
- PMCID: PMC12163010
- DOI: 10.3389/fimmu.2025.1592343
Single-cell transcriptome profiling reveals dynamic cell populations and immune infiltration in cerebral cavernous malformation
Abstract
Introduction: The cellular subpopulations and signaling pathways in the pathological tissues of cerebral cavernous malformation (CCM) remain incompletely understood. To gain a deeper understanding of the pathogenesis of CCM, we aimed to comprehensively map the cellular subpopulations and signaling pathway alterations in the pathological tissues of sporadic CCM patients.
Methods: Lesional brain vascular tissues from CCM patients and normal brain vascular tissues from controls were collected. Multiplex fluorescent immunohistochemistry and single-cell RNA sequencing were performed on the lesional tissues. Differential gene expression, pathway enrichment analysis, and cell-cell communication analysis were conducted to investigate disease-related changes.
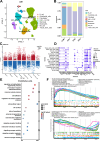
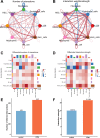
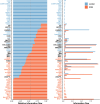
Results: We identified 8 major cell types in the lesion tissues of CCM patients. We observed an increased proportion of monocytes, neutrophils, and NK cells in the lesion tissues of CCM patients. Twenty-eight significantly differentially expressed genes were identified, and pathways such as NK cell-mediated cytotoxicity showed alterations. Cell-cell communication analysis revealed an increase in both the types and strength of communication between cells in the CCM lesion tissues.
Conclusion: This study provides the single-cell transcriptomic analysis of CCM lesions, revealing increased monocytes, neutrophils, and NK cells, along with dysregulated gene expression and signaling pathways. Enhanced intercellular communication, particularly via VEGF and ADGRE5 pathways, highlights potential therapeutic targets for CCM.
Keywords: cell populations; cerebral cavernous malformation; immune infiltration; multiplex fluorescent immunohistochemistry; single-cell RNA sequencing.
Copyright © 2025 Han, Lei, Zhou, Liu, Zhao and He.
Conflict of interest statement
The authors declare that the research was conducted in the absence of any commercial or financial relationships that could be construed as a potential conflict of interest. The author(s) declared that they were an editorial board member of Frontiers, at the time of submission. This had no impact on the peer review process and the final decision.
Figures


Similar articles
-
Transcriptome analysis provides new molecular signatures in sporadic Cerebral Cavernous Malformation endothelial cells.Biochim Biophys Acta Mol Basis Dis. 2020 Dec 1;1866(12):165956. doi: 10.1016/j.bbadis.2020.165956. Epub 2020 Aug 30. Biochim Biophys Acta Mol Basis Dis. 2020. PMID: 32877751
-
Mild Hypoxia Accelerates Cerebral Cavernous Malformation Disease Through CX3CR1-CX3CL1 Signaling.Arterioscler Thromb Vasc Biol. 2024 Jun;44(6):1246-1264. doi: 10.1161/ATVBAHA.123.320367. Epub 2024 Apr 25. Arterioscler Thromb Vasc Biol. 2024. PMID: 38660801 Free PMC article.
-
Transcriptomic signatures of individual cell types in cerebral cavernous malformation.Cell Commun Signal. 2024 Jan 9;22(1):23. doi: 10.1186/s12964-023-01301-2. Cell Commun Signal. 2024. PMID: 38195510 Free PMC article.
-
From Genes and Mechanisms to Molecular-Targeted Therapies: The Long Climb to the Cure of Cerebral Cavernous Malformation (CCM) Disease.Methods Mol Biol. 2020;2152:3-25. doi: 10.1007/978-1-0716-0640-7_1. Methods Mol Biol. 2020. PMID: 32524540 Review.
-
Introduction to cerebral cavernous malformation: a brief review.BMB Rep. 2016 May;49(5):255-62. doi: 10.5483/bmbrep.2016.49.5.036. BMB Rep. 2016. PMID: 26923303 Free PMC article. Review.
References
MeSH terms
LinkOut - more resources
Full Text Sources

