. 2025 May 30:16:1592558.
doi: 10.3389/fimmu.2025.1592558. eCollection 2025.

Transcriptional profiling reveals H.pylori-associated genes induced inflammatory cell infiltration and chemoresistance in gastric cancer

Affiliations

Transcriptional profiling reveals H.pylori-associated genes induced inflammatory cell infiltration and chemoresistance in gastric cancer

Jinshui Tan et al. Front Immunol. .

Abstract

Background: H. pylori infection is closely associated with the tumor microenvironment (TME) in gastric cancer (GC), yet its underlying mechanism is elusive. Hence, it is imperative to explore the microenvironment and drug resistance arising from H. pylori to enhance therapeutic strategies for GC.

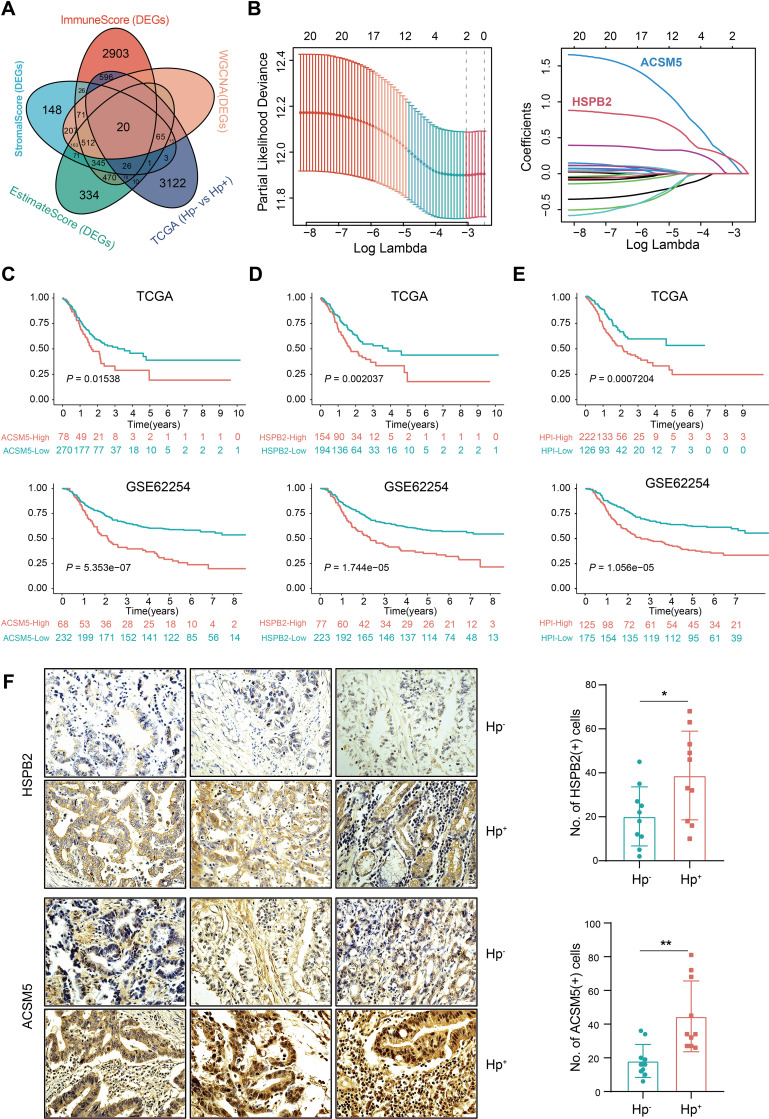
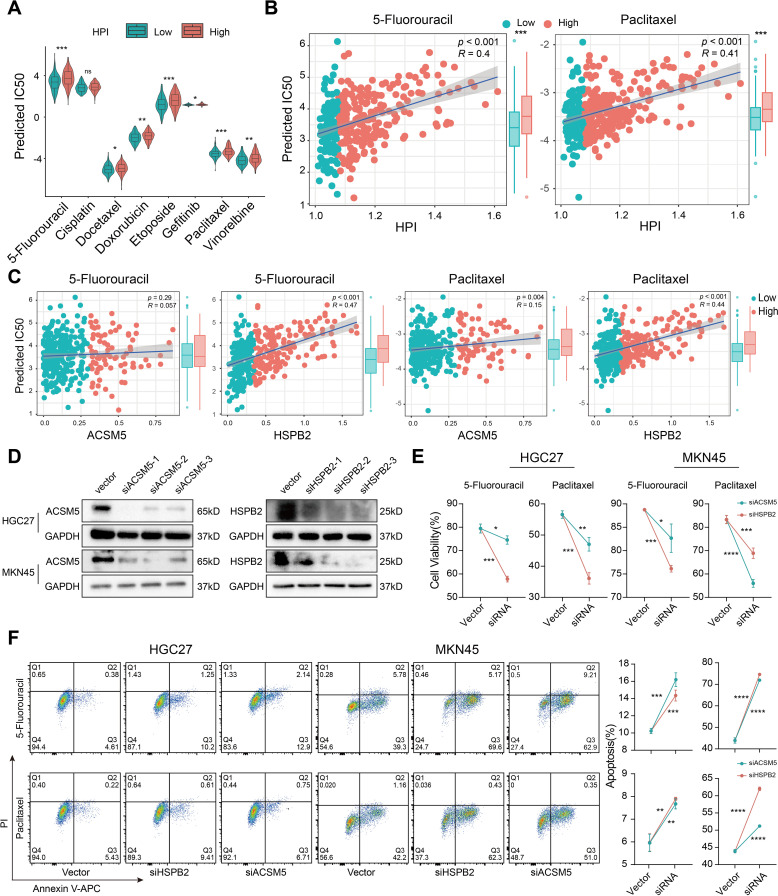
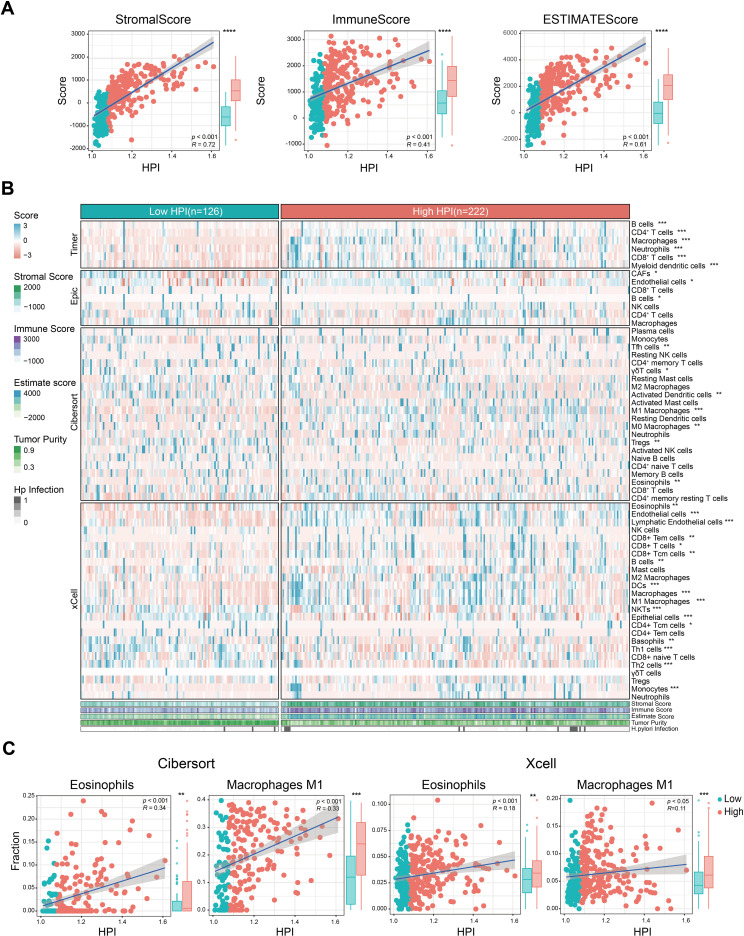
Methods: Employing transcriptional bioinformatics, we computed a H. pylori-associated prognostic index (HPI) using datasets from TCGA and GSE62254 containing ACSM5 and HSPB2 gene expression. We assessed IC50 values for anticancer drugs and immune cell infiltration to evaluate the therapeutics and TME based on the HPI. Further, we validated the transcriptional profiling findings by examining drug sensitivity transfected with siACSM5 and siHSPB2 and analyzing scRNA-seq data and clinical patient samples.

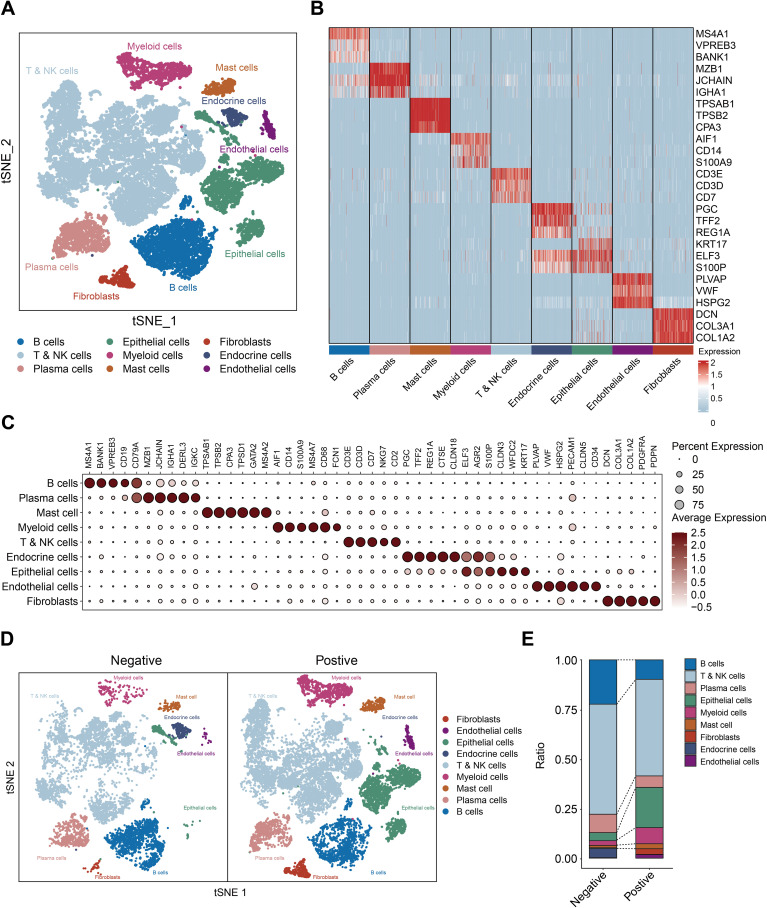
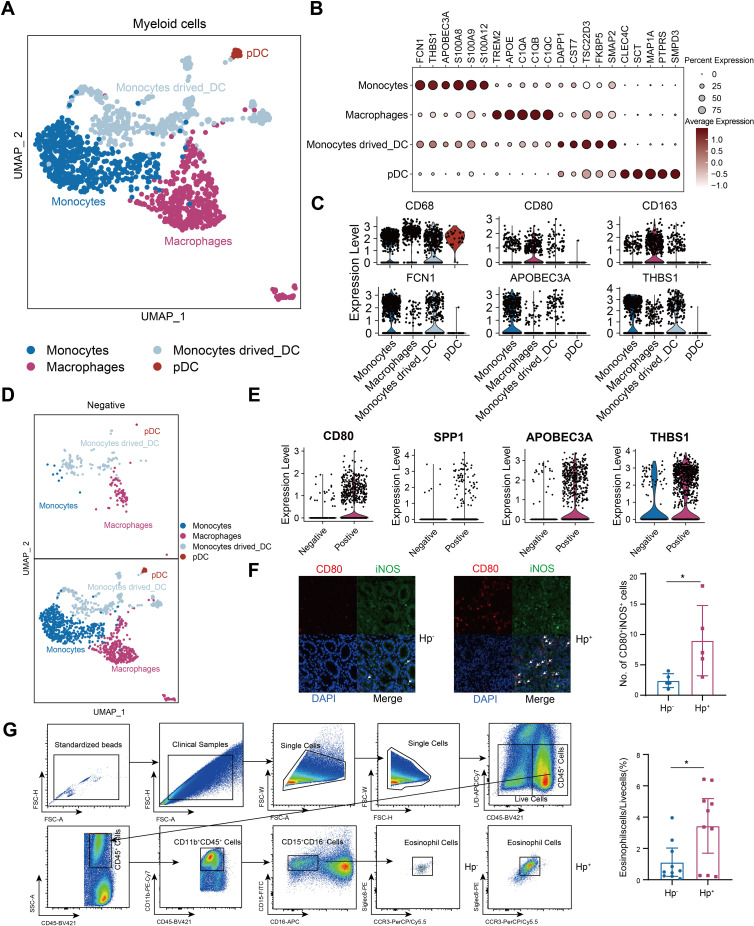
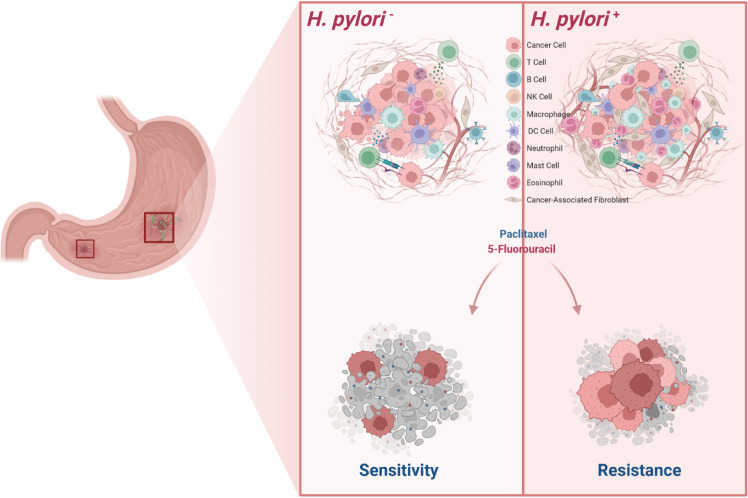
Results: ACSM5 and HSPB2 were identified as correlates of H. pylori infection in GC. Significantly, we established the H. pylori-associated prognostic index (HPI) and found that a high HPI was linked with a worse prognosis. Classification based on the HPI indicated an enhanced infiltration of tumor microenvironment cells and resistance to anti-tumor drugs.

Conclusion: The HPI, reflecting newly identified and complementary biomarkers, correlated with the TME and could accurately project chemoresistance and an altered immune cell distribution in GC patients, thus providing clinical guidance on therapeutic interventions.

Keywords: ACSM5; H. pylori; HspB2; eosinophils; gastric cancer; tumor microenvironment.


Conflict of interest statement

The authors declare that the research was conducted in the absence of any commercial or financial relationships that could be construed as a potential conflict of interest.

Figures

Figure 1
Figure 1
Identification of the H. pylori-associated TME module. (A) WGCNA to screen the significant gene modules associated with the TME and H. pylori infection. The gray, pink, turquoise and yellow modules were finally selected. (B) Correlation between significant module membership and stromal scores and H. pylori infection. (C) Correlation between the single significant module membership (gray, pink, turquoise and yellow module) and stromal scores and H. pylori infection.
Figure 2
Figure 2
Development of the H. pylori-associated index and validation of its prognostic value. (A) Venn diagram shows the intersection of DEGs between the TME score, significant gene modules of WGCNA analysis and H. pylori infection groups in the TCGA. (B) LASSO analysis for identifying the most important genes. The minimal lambda value of HSPB2 is 0.1874 and ACSM5 is 0.2132. (C) Overall survival of ACSM5 expression groups in the TCGA and GSE62254 datasets. (D) Overall survival of the HSPB2 expression groups in the TCGA and GSE62254 datasets. (E) Overall survival of the low and high HPI groups in the TCGA and GSE62254 datasets. (F) Immunohistochemical staining of ACSM5 and HSPB2 on HP negative and positive patients. ns, not significant; *P < 0.05; **P < 0.01.
Figure 3
Figure 3
H. pylori infection induces drug resistance based on the HPI. (A) Comparison of the distribution of IC50 values for common chemotherapy drugs between the low- and high-HPI groups. (B) Association between the HPI and predicted IC50 values of 5-fluorouracil and paclitaxel. (C) Relationship of the expression of ACSM5 and HSPB2 with the predicted IC50 values of 5-fluorouracil and paclitaxel. (D) Western blotting was used to verify the gene knockout efficiency of ACSM5 and HSPB2 siRNA in HGC-27 and MKN45 gastric cancer cell lines. (E) Cell viability assessment after siACSM5 and HSPB2 in HGC-27 and MKN45 gastric cancer cell lines treated with 5-fluorouracil and paclitaxel. (F) Apoptosis rate detection after siACSM5 and HSPB2 in HGC-27 and MKN45 gastric cancer cell lines treated with 5-fluorouracil and paclitaxel. The Wilcoxon test was used to calculate the significant difference between two groups. ns, not significant; *P < 0.05; **P < 0.01; ***P < 0.001, ****P < 0.0001.
Figure 4
Figure 4
Correlation between TME features and H. pylori infection. (A) Relationship of TME scores and tumor purity with HPI. (B) Heatmap of marker expression for tumor microenvironment-associated cells in the different HPI groups. The TME scores, tumor purity and H. pylori infection status are also illustrated under the heatmap. (C) Association between the HPI and the infiltration of macrophages/eosinophils predicted by CIBERSORT and the xCell algorithm. The Wilcoxon test was used to assess the significance of differences between two groups. *P < 0.05; **P < 0.01; ***P < 0.001, ****P < 0.0001.
Figure 5
Figure 5
Profiling the the gastric cancer tumor microenvironment at single-cell level. (A) t-Stochastic Neighbor Embedding (tSNE) of 16653 single cells from 6 patients, allowing the visualization of 9 clusters. (B) Heatmap showing the differentially expressed genes for each cluster. (C) Dot plots showing marker genes. (D) t-Stochastic Neighbor Embedding (tSNE) of the (H) pylori negative and positive samples. (E) the cell ratio of H. pylori negative and positive samples.
Figure 6
Figure 6
H. pylori+ samples withe more myeloid immune cell infiltration. (A)t-Stochastic Neighbor Embedding (tSNE) of the reclustered myeloid cells. (B) Dot plots showing marker genes. (C) Violin plots of each cluster. (D) t-Stochastic Neighbor Embedding (tSNE) of the H. pylori negative and positive samples in myeloid cells. (E) Violin plots of H. pylori negative and positive samples in myeloid cells. (F) The distribution of macrophages was evaluated in H. pylori- and H. pylori+ samples by immunofluorescence (n=5, respectively). (G) The gating strategy and the number of eosinophils in H. pylori- and H. pylori+ samples as determined by flow cytometry (n=10, respectively). The T-test was used to assess the significance of differences between two groups. *P < 0.05.
Figure 7
Figure 7
Schematic diagram of H. pylori induces TME remodeling and chemoresistance in gastric cancer.

Similar articles

References

    1. Sung H, Ferlay J, Siegel RL, Laversanne M, Soerjomataram I, Jemal A, et al. Global cancer statistics 2020: GLOBOCAN estimates of incidence and mortality worldwide for 36 cancers in 185 countries. CA: A Cancer J clinicians. (2021) 71:209–49. doi: 10.3322/caac.21660 - DOI - PubMed
    1. Smyth EC, Nilsson M, Grabsch HI, van Grieken NCT, Lordick F. Gastric cancer. Lancet. (2020) 396:635–48. doi: 10.1016/S0140-6736(20)31288-5 - DOI - PubMed
    1. Kao YS, Chen CW, Wei JC. Helicobacter pylori infection and risk of gastric cancer. Lancet Public Health. (2022) 7:e302. doi: 10.1016/s2468-2667(22)00041-x - DOI - PubMed
    1. Gastli N, Allain M, Lamarque D, Abitbol V, Billoët A, Collobert G, et al. Diagnosis of helicobacter pylori infection in a routine testing workflow: effect of bacterial load and virulence factors. J Clin Med. (2021) 10. doi: 10.3390/jcm10132755. - DOI - PMC - PubMed
    1. Khan P, Ebenezer NS, Siddiqui JA, Maurya SK, Lakshmanan I, Salgia R, et al. MicroRNA-1: Diverse role of a small player in multiple cancers. Semin Cell Dev Biol. (2022) 124:114–26. doi: 10.1016/j.semcdb.2021.05.020 - DOI - PMC - PubMed

MeSH terms

LinkOut - more resources