. 2025 May 27;21(8):3631-3648.
doi: 10.7150/ijbs.110904. eCollection 2025.

Emodin Inhibits NLRP3 Inflammasome Activation and Protects Against Sepsis via Promoting FUNDC1-Mediated Mitophagy

Affiliations

Emodin Inhibits NLRP3 Inflammasome Activation and Protects Against Sepsis via Promoting FUNDC1-Mediated Mitophagy

Wei Fu et al. Int J Biol Sci. .

Abstract

Dysregulated activation of the NLR family pyrin domain-containing 3 (NLRP3) inflammasome contributes to the pathogenesis of numerous inflammatory and infectious diseases; however, effective targeted therapies remain elusive. In this study, we identify emodin-a bioactive anthraquinone derived from Rheum palmatum (radix Rhei) and Polygonum cuspidatum (Polygonaceae)-as a potent and selective inhibitor of NLRP3 inflammasome activation. Notably, emodin disrupts the assembly of the NLRP3 complex without impairing inflammasome priming. Transcriptomic profiling via RNA sequencing reveals that emodin reprograms mitochondrial quality control pathways, markedly enhancing mitophagy flux. Mechanistically, emodin suppresses casein kinase II (CK2)-mediated phosphorylation of FUNDC1, a pivotal mitophagy receptor, thereby promoting mitochondrial clearance and preventing mitochondrial reactive oxygen species-induced NLRP3 inflammasome assembly. Both genetic silencing of FUNDC1 and pharmacological inhibition of mitophagy with 3-methyladenine abrogated abrogate the inhibitory effects of emodin, establishing a direct mechanistic link between FUNDC1-dependent mitophagy and NLRP3 regulation. In vivo, emodin confers significant protection in sepsis models, with these protective effects being lost in NLRP3-deficient mice or upon macrophage-specific deletion of FUNDC1. Collectively, our findings uncover a novel CK2-FUNDC1-mitophagy axis through which emodin inhibits NLRP3 inflammasome activation, highlighting its promise as a clinically translatable candidate for the treatment of NLRP3-driven inflammatory diseases.

Keywords: Emodin; FUNDC1; Mitochondrial homeostasis; Mitophagy; NLRP3 inflammasome; Sepsis..


Conflict of interest statement

Competing Interests: The authors have declared that no competing interest exists.

Figures
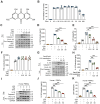
Figure 1
Figure 1
Emodin inhibits NLRP3 inflammasome activation in both BMDMs and human PBMCs. (A) Chemical structure of emodin (Emo). (B) BMDMs maintained viability after treatment with various doses of emodin (n = 5 per group). (C-F) Western blot analysis reveals alterations in NLRP3, pro-caspase-1, ASC, and pro-IL-1β expression in lysates (Lys) and IL-1β (p17), caspase-1 (p20) in supernatants (Sup) of BMDMs treated with emodin. The levels of IL-1β, LDH, and TNF-α in BMDM were quantified (n = 6 per group). (G-H) Western blot analysis reveals alterations in NLRP3, pro-caspase-1, ASC, and pro-IL-1β expression in Lys and IL-1β (p17), caspase-1 (p20) in Sup of BMDMs treated with emodin (G). Pam3CSK4 and transfected with LPS after emodin and IL-1β levels in Sup (n = 6 per group) (H). (I-K) Western blot analysis reveals alterations in pro-caspase-1 and pro-IL-1β expression in Lys and IL-1β (p17), caspase-1 (p20) in Sup of PBMCs treated with emodin(I). Quantification revealed reduced IL-1β (J) and LDH (K) levels in Sup (n = 6 per group). Data are presented as mean ± SEM from three independent experiments with statistical significance at ***P<0.001.
Figure 2
Figure 2
Emodin does not suppress NLRP3 priming but impedes NLRP3-mediated ASC oligomerization. (A) Western blot analysis was conducted on the specified proteins in Lys from BMDMs that were either exposed to LPS for 4 h prior to treatment with varying concentrations of emodin for 1 h (emodin post-LPS) or pretreated with different doses of emodin for 1 h followed by LPS stimulation for 4 h (emodin pre-LPS). (B) Immunofluorescence images depict the subcellular localization of ASC (green) in LPS-primed BMDMs stimulated with nigericin, with or without emodin. Nuclei are counterstained with DAPI (blue); scale bar: 20 μm. The proportion of cells exhibiting ASC specks (green) in BMDMs was quantified. (C) Western blot analysis was carried out to assess cross-linked ASC in BMDMs subjected to the same treatment as in (B). Data are expressed as the mean ± SEM from three independent experiments, with biological duplicates for (B), or are representative of three independent experiments for (A, C). **P<0.01 vs the control.
Figure 3
Figure 3
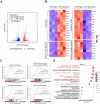
Emodin modulates mitochondrial homeostasis and mitophagy upon NLRP3 inflammasome activation. (A) Volcano plots illustrate the differential gene expression between the LPS + nigericin and LPS + nigericin + emodin treatment groups. Genes up-regulated and down-regulated are highlighted in red and blue, respectively. (B) A heatmap presents the relative mRNA expression of genes associated with mitophagy, mitochondrial function, oxidative stress, and reactive oxygen species in the two treatment groups: LPS + nigericin and LPS + nigericin + emodin. (C) Gene Set Enrichment Analysis (GSEA) was conducted to identify significantly up-regulated genes in the LPS + nigericin + emodin group versus the LPS + nigericin group. (D) GO Pathway Enrichment Analysis (focusing on Biological Process, BP) was performed based on the differentially expressed genes (DEGs).
Figure 4
Figure 4
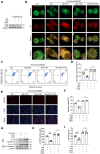
Emodin enhances mitophagy to preserve mitochondrial homeostasis, subsequently inhibiting NLRP3 inflammasome activation. BMDMs primed with LPS were pretreated with 3-MA (5mM for 1 h) prior to emodin treatment (25μM for 1 h), followed by nigericin stimulation (10 μM for 30 min). (A) Western blot analysis was conducted on the specified proteins in Lys. (B) Confocal microscopy was employed to observe the colocalization of LC3 (red) with mitochondria (green). Scale bar: 10μm. (C-D) BMDMs were labeled with Mitotracker Green (for total mitochondria) and Mitotracker Deep Red (for respiring mitochondria), and subsequently analyzed using flow cytometry. (E-F) BMDMs were stained with MitoSOX and examined under a fluorescence microscope. Scale bar: 40μm. (G-I) Western blot analysis was performed to detect IL-1β (p17), caspase-1 (p20) in Sup, and pro-IL-1β (p30), caspase-1 (p45), NLRP3, and ASC in Lys (G). The levels of IL-1β (H) and LDH (I) in the Sup were quantified. Data are presented as mean ± SEM from three independent experiments with biological duplicates for (D, F, H, I), or are representative of three independent experiments for (A, G). **P<0.01 compared to control. ***P<0.001 compared to control. ns, not significant.
Figure 5
Figure 5
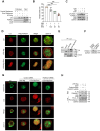
Emodin suppresses NLRP3 inflammasome activation via FUNDC1-mediated mitophagy. (A) Cell lysates of LPS-primed THP-1 with or without nigericin incubated with emodin-Sepharose. The pull-down samples and input were analyzed by western blot. (B) Effect of emodin on the ATPase activity of CK2. After incubation CK2 plus indicated different concentrations of free emodin (12.5 μM, 25 μM, and 50μM), ATP was measured by CellTiter-Glo Assay Kit and normalized to the control. (C) THP-1 cells, primed with LPS, were exposed to emodin or a vehicle control, followed by nigericin stimulation. Western blot analysis was conducted to assess levels of LC3II, FUNDC1, and p-FUNDC1. (D) THP-1 cells were transfected with Flag-tagged FUNDC1 and subjected to the same treatment as in (C). Confocal microscopy was used to examine the colocalization of LC3 (red) and Flag-FUNDC1 (green). Scale bars: 10 μm. (E) Cell Lys underwent immunoprecipitation with an anti-LC3 antibody, and subsequent western blot was performed to evaluate the interaction between LC3 and FUNDC1 in THP-1 cells treated as in (C). (D-F) THP-1 cells were transfected with FUNDC1 siRNA or a negative control siRNA for 24 h, followed by the treatment regimen outlined in the Figure. Western blot analysis was employed to measure FUNDC1 expression in Lys (D). Confocal microscopy was used to visualize the colocalization of LC3 (red) and Mitotracker (green). Scale bars: 10 μm (E). Western blot analysis was conducted to detect IL-1β (p17), caspase-1 (p20) in the Sup and pro-IL-1β (p30), caspase-1 (p45), LC3II in Lys (F). The data presented are representative of three independent experiments. **P<0.01 compared to control. ***P<0.001 compared to control. ns, not significant.
Figure 6
Figure 6
Emodin demonstrates protective efficacy against sepsis induced by LPS. (A) Schematic overview of the experimental design. (B) The survival rates of male C57BL/6 mice were monitored for 72 hours after intraperitoneal injection of LPS (10 mg/kg), with or without pretreatment with emodin (20 mg/kg). Statistical analysis was performed using the log-rank test. (C-D) Concentrations of IL-1β and TNF-α in serum (C) and PLF (D) were quantified using ELISA. (E-F) Representative H&E-stained histological images of lung (E) and liver (F) tissues are shown. Scale bar: 100 μm. (G) Western blot analysis was conducted to evaluate the protein expression levels of NLRP3, pro-caspase-1 (p45), caspase-1 (p20), and LC3II in lung tissue. Data are expressed as mean ± SEM or are representative of at least two independent experiments, with 5-7 animals per group. *P<0.05 compared to the control. ***P<0.001 compared to the control.
Figure 7
Figure 7
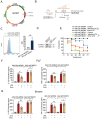
Emodin's effects on LPS-induced sepsis rely on FUNDC1-mediated mitophagy. (A) Schematic representation of the AAV-F4/80p-EGFP-MIR155(RNAi)-SV40-PolyA construct (AAV-shFUNDC1). (B) Experimental design overview: Mice were administered tail vein injections of either AAV-shFUNDC1 or AAV-Ctrl-shRNA. After 21 days, mice were pretreated with emodin (20 mg/kg), followed by an intraperitoneal injection of LPS (10 mg/kg) one hour later. (C) Flow cytometry was used to evaluate GFP expression in lung macrophages from mice infected with AAV-Ctrl-shRNA or AAV-shFUNDC1 on day 21. (D) Western blot analysis of FUNDC1 expression in lung tissue from mice infected with AAV-shFUNDC1 or AAV-Ctrl-shRNA. (E) Survival rates of male C57BL/6 mice were tracked over 72 hours. Statistical significance was assessed using the log-rank test. (F-G) IL-1β and TNF-α levels in serum (F) and PLF (G) were quantified by ELISA. (H-I) Representative H&E-stained images of lung (H) and liver (I) tissues. Scale bar: 100 μm. (J) Western blot analysis was conducted to measure the expression levels of NLRP3, pro-caspase-1 (p45), caspase-1 (p20), FUNDC1, and LC3II proteins in lung tissue. Data are expressed as mean ± SEM. Results are representative of at least two independent experiments, with 5-7 animals per group. *P<0.05 compared to control. **P<0.01 compared to control. ***P<0.001 compared to control. ns, not significant.
Figure 7
Figure 7
Emodin's effects on LPS-induced sepsis rely on FUNDC1-mediated mitophagy. (A) Schematic representation of the AAV-F4/80p-EGFP-MIR155(RNAi)-SV40-PolyA construct (AAV-shFUNDC1). (B) Experimental design overview: Mice were administered tail vein injections of either AAV-shFUNDC1 or AAV-Ctrl-shRNA. After 21 days, mice were pretreated with emodin (20 mg/kg), followed by an intraperitoneal injection of LPS (10 mg/kg) one hour later. (C) Flow cytometry was used to evaluate GFP expression in lung macrophages from mice infected with AAV-Ctrl-shRNA or AAV-shFUNDC1 on day 21. (D) Western blot analysis of FUNDC1 expression in lung tissue from mice infected with AAV-shFUNDC1 or AAV-Ctrl-shRNA. (E) Survival rates of male C57BL/6 mice were tracked over 72 hours. Statistical significance was assessed using the log-rank test. (F-G) IL-1β and TNF-α levels in serum (F) and PLF (G) were quantified by ELISA. (H-I) Representative H&E-stained images of lung (H) and liver (I) tissues. Scale bar: 100 μm. (J) Western blot analysis was conducted to measure the expression levels of NLRP3, pro-caspase-1 (p45), caspase-1 (p20), FUNDC1, and LC3II proteins in lung tissue. Data are expressed as mean ± SEM. Results are representative of at least two independent experiments, with 5-7 animals per group. *P<0.05 compared to control. **P<0.01 compared to control. ***P<0.001 compared to control. ns, not significant.

References

    1. Swanson KV, Deng M, Ting JP. The NLRP3 inflammasome: molecular activation and regulation to therapeutics. Nat Rev Immunol. 2019;19:477–89. - PMC - PubMed
    1. Zhan X, Li Q, Xu G, Xiao X, Bai Z. The mechanism of NLRP3 inflammasome activation and its pharmacological inhibitors. Front Immunol. 2022;13:1109938. - PMC - PubMed
    1. Franchi L, Eigenbrod T, Núñez G. Cutting edge: TNF-alpha mediates sensitization to ATP and silica via the NLRP3 inflammasome in the absence of microbial stimulation. J Immunol. 2009;183:792–6. - PMC - PubMed
    1. Bauernfeind FG, Horvath G, Stutz A, Alnemri ES, MacDonald K, Speert D. et al. Cutting edge: NF-kappaB activating pattern recognition and cytokine receptors license NLRP3 inflammasome activation by regulating NLRP3 expression. J Immunol. 2009;183:787–91. - PMC - PubMed
    1. Xing Y, Yao X, Li H, Xue G, Guo Q, Yang G. et al. Cutting Edge: TRAF6 Mediates TLR/IL-1R Signaling-Induced Nontranscriptional Priming of the NLRP3 Inflammasome. J Immunol. 2017;199:1561–6. - PubMed

MeSH terms