. 2025 May 7;21(8):3397-3415.
doi: 10.7150/ijbs.111636. eCollection 2025.

Luteolin improves precancerous conditions of the gastric mucosa by binding STAT3 and inhibiting LCN2 expression

Affiliations

Luteolin improves precancerous conditions of the gastric mucosa by binding STAT3 and inhibiting LCN2 expression

Xinyu Hao et al. Int J Biol Sci. .

Abstract

Inhibition of malignant transformation from the precancerous stage has important clinical value for the prevention of gastric cancer. Here, we report a strategy to inhibit precancerous gastric conditions by Luteolin (Lut). Lut treatment resulted in remarkable resistance to oxyntic atrophy, spasmolytic polypeptide-expressing metaplasia (SPEM), and gastric mucosal injury in tamoxifen (TAM)-treated mice, chenodeoxycholic acid-treated rats, and human organoids. Mechanism study suggested that LCN2 expression was upregulated in the SPEM mucosa and downregulated after Lut treatment. LCN2 blocking suppressed TAM-induced oxyntic atrophy and metaplasia and partially counteracted the effect of Lut. Quantitative chemoproteomics identified that Lut bound to STAT3 and inhibited its phosphorylation. Functional experiments using STAT3 inhibitors and epithelial cell-specific Stat3 deficient mice showed that STAT3 inhibition and deletion attenuated the beneficial effects of Lut. Our data supported that Lut might be a therapeutic candidate for the treatment of gastric mucosal injury by binding to STAT3 and thereby inhibiting the STAT3/LCN2 axis.

Keywords: Gastric cancer; LCN2; Luteolin; Precancerous gastric conditions; STAT3; Spasmolytic polypeptide-expressing metaplasia.


Conflict of interest statement

Competing Interests: The authors have declared that no competing interest exists.

Figures
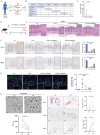
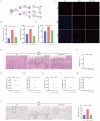
Figure 1
Figure 1
Protective effect of Lut against CAG/IM patients and intervention of TAM. (A) Schematic image showing detection of Lut in serum in TCM intervention patients. (B) Histopathology of the patient's gastric mucosa compartments during the follow-up period. (C) Comparison of serum Lut content in patients with and without pathological improvement. N=5-7. (D) Schematic image showing 20 or 40 mg/kg Lut in the treatment of TAM-intervention mice. (E) H&E images of the gastric corpus from TAM intervention mice treated with Lut. N=6. Scale bars: 100 μm. (F) Representative IHC images for ATP4A and Mist1 in the gastric corpus of mice. N=6. Scale bar: 100 μm. (G) Representative IF images of GSII and GIF double positive cells in the gastric corpus of mice. N=4-6. Scale bars: 50 μm. (H) Representative bright-field and sizes of organoids in Lut-treated and NC. N=5. Scale bars: 100 μm. Fifteen organoids per well were measured. (I) Representative H&E and IHC images for ATP4A and Mist1 of organoids treated with Lut and NC. N=5. Scale bars: 100 μm. All data are presented as mean±SEM. *P<0.05, **P<0.01, ****P<0.0001. CAG, chronic atrophic gastritis; IM, intestinal metaplasia; TCM, traditional Chinese medicine; Lut, luteolin; BT, before treatment; AT, after treatment; H&E, hematoxylin and eosin; NC, negative control; TAM, tamoxifen; IHC, immunohistochemistry; IF, immunofluorescence; ns, no statistical significance.
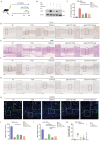
Figure 2
Figure 2
Protective effect of Lut against CDCA-intervened models. (A) Schematic image showing the CDCA intervention and Lut treatment for cells. (B) RT-qPCR for CDX2 and KLF4; the mRNA expression was normalized to β-actin. N=3. (C) Representative IF image for MUC2 in CDCA-intervened and Lut-treated cells. N=3. Scale bars: 20 μm. (D) The mean fluorescence intensity of MUC2. N=3. (E) H&E images of the stomach of CDCA-intervention rats treated with Lut. N=6. Scale bars: 100 μm. (F) Graph for inflammation scores of stomach of rats. N=6. (G) Epithelial defect scores in the stomach of rats. N=6. (H) Oxyntic atrophy scores of the stomach of rats. N=6. (I) Hyperplasia scores of the stomachs of rats. N=6. (J) Pseudopyloric scores of stomachs of rats. N=6. (K) Dysplasia/neoplasia scores of stomachs of rats. N=6. (L) Representative IHC images for Ki67 in stomach specimens of rats. N=6. Scale bar: 100 μm. Data are presented as mean±SEM or median (Q1, Q3). *P<0.05, **P<0.01, ***P<0.001, ****P<0.0001. DMSO, dimethyl sulfoxide; CDCA, chenodeoxycholic acid; IF, immunofluorescence; NC, negative control; Lut, luteolin; RT-qPCR, reverse transcription-quantitative PCR; H&E, hematoxylin and eosin; IHC, immunohistochemistry; ns, no statistical significance.
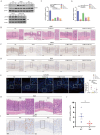
Figure 3
Figure 3
RNA-seq of the gastric mucosa and LCN2 expression in humans, mice and organoids. (A) Schematic image showing the RNA-seq strategy for the TAM-treated, Lut-treated, and NC mice. N=3-4. (B) The Venn diagram of 242 DEGs obtained by overlapping TAM vs. NC and Lut vs. TAM. (C) Bubble plot showing the top 20 selected KEGG enriched terms. (D) Heatmap showing DEGs in TAM-treated compared with NC mice and Lut-treated compared with TAM-treated mice. (E) Representative IHC images for LCN2 in non-atrophic gastritis and pyloric gland metaplasia of human tissue. N=6-8. Scale bar: 100 μm. (F) Representative IHC images for LCN2 in the gastric corpus of mice. N=8-9. Scale bar: 100 μm. (G) Representative IHC images for LCN2 in organoids. N=5. (H) RT-qPCR for LCN2 in stomach of mice; the mRNA expression level was normalized to β-actin. N=3-4. All data are presented as mean±SEM. *P<0.05, **P<0.01. RNA-seq, RNA sequencing; TAM, tamoxifen; Lut, luteolin; NC, negative control; DEGs, differentially expressed genes; KEGG, Kyoto Encyclopedia of Genes and Genomes pathways; IHC, immunohistochemistry; RT-qPCR, reverse transcription-quantitative PCR.
Figure 4
Figure 4
Inhibition of oxyntic atrophy and metaplasia and counteraction the effect of Lut in LCN2 blocking mice after TAM intervention. (A) Schematic image showing anti-LCN2 antibody and Lut for TAM-treated mice. (B) Western blotting for LCN2 in stomach of mice. (C) Graph of positive area of LCN2. N=6-8. (D) Representative IHC images for LCN2 in the gastric corpus of mice. N=6-8. Scale bar: 100 μm. (E) H&E images in the gastric corpus of mice. N=6-8. Scale bars: 100 μm. (F) Representative IHC images for ATP4A in the gastric corpus of mice. N=6-8. Scale bars: 100 μm. (G) Representative IHC images for Mist1 in the gastric corpus of mice. N=6-8. Scale bars: 100 μm. (H) Representative IF images of GSII and GIF double positive cells in the gastric corpus of mice. N=6-7. Scale bars: 50 μm. (I) Graph of positive area of ATP4A. N=6-8. (J) Graph of positive area of Mist1. N=6-8. (K) Co-stained with GSII and GIF positive cells. N=6-7. All data are presented as mean±SEM. *P<0.05, **P<0.01, ***P<0.001, ****P<0.0001. TAM, tamoxifen; Lut, luteolin; IHC, immunohistochemistry; NC, negative control; H&E, hematoxylin and eosin; IF, immunofluorescence.
Figure 5
Figure 5
Expression site and cell origin of LCN2. (A) Identification of cell clusters in gastric tissue (normal mucosa/precancerous lesions/gastric adenocarcinoma). The whole cell data were subclustered into eight group using conserved maker genes. Epithelial cells were subclustered into six group using conserved maker genes. LCN2 expression in (B) gastric tissue, (C) MUC5AC+ epithelial cells in normal mucosa/precancerous lesions, and gastric adenocarcinoma groups, (D) in MUC6+ epithelial cells in normal mucosa/precancerous lesions, and gastric adenocarcinoma groups, (E) in proliferative epithelial cells in normal mucosa/precancerous lesions, and gastric adenocarcinoma groups, and (F) in chief cells in normal mucosa/precancerous lesions, and gastric adenocarcinoma groups. (G) Representative images of mIHC showing the LCN2 and composition of corpus cell lineage in human. LCN2 was labeled as orange; MUC6, MUC5AC, Mist1, and DAPI were labeled as mucous neck cells (green), foveolar cells (yellow), chief cells (purple), and nuclei (blue), respectively. Scale bar: 100 μm. mIHC, multiplex immunohistochemistry staining.
Figure 6
Figure 6
Target profiling of Lut by quantitative chemoproteomics and direct interaction of STAT3 and Lut. (A) Schematic image showing the workflow of profiling of Lut-interacting proteins by quantitative chemoproteomics. (B) Venn diagrams showing the number of identified Lut-interacting proteins from the lysates of GES-1 cells. (C) Ratio distribution of proteins enriched by the Lut photo-cross-linking probe. (D) KEGG analysis of the 249 protein targets identified by quantitative chemoproteomics. (E) Experimental validation of Lut-STAT3 interactions by western blotting. (F) The binding affinities between Lut and STAT3 was detected by SPR analysis. (G) The Kd value of Lut and STAT3 was determined as 21.8 μM by SPR. All data are presented as mean±SEM. ***P<0.001. SPR, surface plasmon resonance.
Figure 7
Figure 7
Counteraction the effect of Lut in p-STAT3-inhibited mice and Stat3fl/flVillinCre mice after TAM intervention. (A) Western blotting for p-STAT3 and STAT3 in Lut-treated, TAM-treated mice, and CDCA-intervented cells. (B) H&E images in the gastric corpus of mice. N=4-7. Scale bars: 100 μm. (C) Representative IHC images for ATP4A in the gastric corpus of mice. N=4-7. Scale bars: 100 μm. (D) Representative IHC images for Mist1 in the gastric corpus of mice. N=4-7. Scale bars: 100 μm. (E) Representative IF images of GSII and GIF double positive cells in the gastric corpus of mice. N=4-6. Scale bars: 50 μm. (F) Graph of positive area of ATP4A. N=4-7. (G) Graph of positive area of Mist1. N=4-7. (H) H&E images of the corpus from WT(Stat3fl/fl) and KO(Stat3fl/flVillinCre) mice during Lut treatment. Scale bars: 100 μm. (I) Representative IHC images for ATP4A in WT(Stat3fl/fl) and KO (Stat3fl/flVillinCre) mice. N=5. Scale bar: 100 μm. (J) Graph of positive area of ATP4A. N=5. All data are presented as mean±SEM. *P<0.05, **P<0.01, ***P<0.001, ****P<0.0001. Lut, luteolin; TAM, tamoxifen; CDCA, chenodeoxycholic acid; H&E, hematoxylin and eosin; IHC, immunohistochemistry; IF, immunofluorescence; WT, wild-type; KO, knockout.

References

    1. Wong MCS, Huang J, Chan PSF. et al. Global Incidence and Mortality of Gastric Cancer, 1980-2018. JAMA Netw Open. 2021;4:e2118457. - PMC - PubMed
    1. Jeong H, Lee B, Kim KH. et al. WFDC2 Promotes Spasmolytic Polypeptide-Expressing Metaplasia Through the Up-Regulation of IL33 in Response to Injury. Gastroenterology. 2021;161:953–967.e15. - PMC - PubMed
    1. Bockerstett KA, Lewis SA, Noto CN. et al. Single-Cell Transcriptional Analyses Identify Lineage-Specific Epithelial Responses to Inflammation and Metaplastic Development in the Gastric Corpus. Gastroenterology. 2020;159:2116–2129.e4. - PMC - PubMed
    1. Caldwell B, Meyer AR, Weis JA. et al. Chief cell plasticity is the origin of metaplasia following acute injury in the stomach mucosa. Gut. 2022;71:1068–1077. - PMC - PubMed
    1. He Z, Li X, Wang Z, Protective effects of luteolin against amyloid beta-induced oxidative stress and mitochondrial impairments through peroxisome proliferator-activated receptor γ-dependent mechanism in Alzheimer's disease. Redox Biol. 2023. 66102848. - PMC - PubMed

LinkOut - more resources