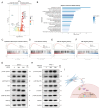
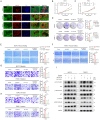
. 2025 May 27;21(8):3573-3596.
doi: 10.7150/ijbs.108618. eCollection 2025.

Integrative Single-Cell and Spatial Transcriptomics Analysis Reveals ECM-remodeling Cancer-associated Fibroblast-Derived POSTN as a Key Mediator in Pancreatic Ductal Adenocarcinoma Progression

Affiliations

Integrative Single-Cell and Spatial Transcriptomics Analysis Reveals ECM-remodeling Cancer-associated Fibroblast-Derived POSTN as a Key Mediator in Pancreatic Ductal Adenocarcinoma Progression

Yifan Wu et al. Int J Biol Sci. .

Abstract

Pancreatic ductal adenocarcinoma (PDAC) presents significant clinical challenges owing to its dense stroma and complex tumor microenvironment (TME). In this study, large-scale single-cell transcriptomics and spatial transcriptomics (ST) were integrated to dissect the heterogeneity of fibroblasts and their crosstalk with epithelial cells, with a focus on key ligand-receptor interactions. Eight distinct fibroblast subpopulations were identified, among which extracellular matrix (ECM)-remodeling fibroblasts were particularly enriched in tumor tissues and associated with poor prognosis. ECM-remodeling fibroblasts were located at the terminal stage of the fibroblast pseudotime trajectory, and SOX11 was identified as a key transcription factor in this subpopulation. Further analyses revealed that ECM-remodeling fibroblasts can interact with epithelial cells through the POSTN-ITGAV/ITGB5 ligand-receptor axis, a critical pathway that promotes tumor progression. Clinical analyses demonstrated a strong correlation between POSTN expression and poor prognosis in patients with PDAC. Mechanistically, POSTN interacts with integrin ITGAV/ITGB5 on tumor cells, activating the PI3K/AKT/β-catenin pathway and promoting epithelial-mesenchymal transition (EMT) phenotype. Pharmacological inhibition of the POSTN-integrin axis partially reversed these malignant traits, highlighting its potential as a therapeutic target. This study provides new insights into fibroblast heterogeneity and its role in PDAC progression, emphasizing the POSTN-ITGAV/ITGB5 axis as a promising target for therapeutic interventions.

Keywords: Cancer-associated fibroblasts; Heterogeneity; POSTN; Pancreatic ductal adenocarcinoma; Single-cell RNA sequencing; Stroma-tumor crosstalk.


Conflict of interest statement

Competing Interests: The authors have declared that no competing interest exists.

Figures

Figure 1
Figure 1
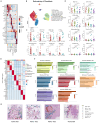
Integrated single-cell and spatial transcriptomic atlas of PDAC samples. (A) UMAP plot showing 11 major cell types in the discovery cohort. (B) Dot plot illustrating the expression of classical marker genes in major cell types. (C) Feature plot showing the expression of classical marker genes in corresponding cell types, with color intensity indicating the expression levels. (D) Heatmap showing the proportion of major cell types in each individual sample of the discovery cohort. (E) Circle plots showing differential interaction numbers and strengths between malignant and non-malignant samples in the discovery cohort. Blue lines indicate decreased communication, while red lines indicate increased communication in malignant compared to non-malignant pancreatic samples. (F) UMAP plot showing major cell types in validation cohort. (G) Heatmaps showing differential interaction numbers and strengths between malignant and non-malignant samples in the validation cohort. (H) The spatial distribution of major cell types in spatial transcriptome data (CellTrek deconvolution).
Figure 2
Figure 2
Heterogeneity analysis of fibroblasts in discovery cohort. (A) Dot plot showing classical marker gene expression for fibroblast subclusters. (B) UMAP plot showing the identified fibroblast subtypes. (C-D) Scatterplots depicting the proportions of fibroblast subtypes infiltration in malignant and non-malignant samples, as well as across different clinical stages of PDAC samples in the discovery cohort. P-values for group comparisons were calculated using t-tests. (E) Heatmap showing z-score normalized expression of canonical markers across fibroblast subtypes. (D) GO analysis of upregulated genes in fibroblast subtypes, with color intensity indicating the scaled -log10 P-value. (F) The spatial distribution of fibroblast subtypes in PDAC samples (CellTrek).
Figure 3
Figure 3
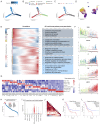
Evolutionary trajectories and transcriptional regulatory analysis of fibroblast subtypes in the discovery cohort. (A) Pseudotime analysis of fibroblast developmental trajectories inferred by Monocle2, with blue intensity indicating the temporal order (dark blue representing the starting state). (B-C) Evolutionary trajectories of fibroblasts inferred by Monocle2, colored by subtype (B) and state (C). (D) Validation of fibroblast evolutionary trajectories using Monocle3. (E) Heatmap showing scaled expression of differentially expressed genes along the pseudotime trajectory. Bar plots on the right highlight the top significantly enriched pathways for each gene cluster. (F) Pseudotime projection of fibroblast subtype marker expression, illustrating the developmental trajectories of fibroblast subtypes in PDAC samples. (G) Heatmap showing the mean activity of top differentially activated regulons in each fibroblast subtype, inferred by pySCENIC. (H) Dot plot ranking the top differentially activated regulons in ECM-remodeling fibroblasts based on regulon-specific scores. (I) Violin plot showing SOX11 expression across fibroblast subtypes. (J) Triangle heatmap of Pearson correlations between SOX11 mRNA expression and marker gene of ECM-remodeling fibroblasts expression in the TCGA-PAAD dataset. (K-L) Kaplan-Meier curves for overall survival (K) and disease-free survival (L) of TCGA-PAAD patients stratified by high- and low- SOX11 mRNA expression levels.
Figure 4
Figure 4
Identification of epithelial meta-programs in the discovery cohort. (A) Heatmap showing Jaccard similarity indices for robust NMF programs based on the top 50 genes. Programs are grouped into meta-programs (MPs, red dashed lines), with MP families labeled on the right. (B) Feature plot of epithelial meta-program gene list scores calculated using the AddModuleScore function in Seurat (MP1-MP8). Colors indicate score levels, ranging from no expression (blue) to high expression (red). (C) UMAP plot visualizing epithelial subclusters, with distinct colors representing different subtypes. (D) Scatterplot of epithelial subtype infiltration proportions in malignant vs. non-malignant samples. P-values were calculated using t-tests for group comparisons. (E) Heatmap showing z-score normalized expression of canonical markers across epithelial subtypes. (F) GO enrichment analysis of upregulated genes significantly enriched in each epithelial subtype. (G) CNV score levels of epithelial subtypes inferred by inferCNV. (H) Kaplan Meier curves for OS of TCGA-PAAD patients stratified by EMT-related epithelial subtype-specific signature expression.
Figure 5
Figure 5
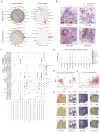
Potential interactions between ECM-remodeling fibroblasts and the EMT-related epithelial subtype with POSTN as a key secreted ligand. (A) Circle plots comparing cell-cell communication networks, showing the number and strength of interactions between fibroblast and epithelial subpopulations in malignant versus non-malignant samples. (B) Spatial distribution of ECM-remodeling fibroblasts and EMT-related epithelial cells in PDAC samples based on CellTrek deconvolution, with yellow boxes indicating potential co-localization regions. (C) Bubble plots comparing secreted ligand-receptor pairs from ECM-remodeling fibroblasts targeting epithelial subtypes between malignant and non-malignant samples. (D) Violin plot showing POSTN expression across all samples in the discovery cohort, grouped by major cell types. (E) Feature plot highlighting predominant POSTN expression in the ECM-remodeling fibroblast subpopulation. (F) Pseudotime projection plot showing gradual upregulation of POSTN along the fibroblast evolutionary trajectory. (G) Spatial feature plot showing the expression of POSTN, ITGAV, and ITGB5.
Figure 6
Figure 6
POSTN is highly expressed in the stromal area of PDAC and is positively associated with tumor progression and overall survival. (A) POSTN mRNA levels in pancreatic cancer tissues (n = 179) compared to normal tissues (n = 171, GTEx matched) analyzed via the GEPIA database. (B) Kaplan Meier curves for DFS of TCGA-PAAD patients stratified by high- and low- POSTN mRNA expression levels (cutoff: quantile) via GEPIA. (C) Representative IHC staining images of POSTN in PDAC tissues and paired adjacent normal tissues from patients in the PUCH-PDAC cohort. (D) IHC scores of POSTN in 30 paired PDAC and adjacent normal tissues (n = 30 per group). (E-F) Kaplan Meier curves for OS (E) and DFS (F) of patients within PUCH-PDAC cohort stratified by high- and low- POSTN expression levels. (G-L) Associations between POSTN IHC scores and clinical features, including TNM stages, tumor size, vascular invasion, tumor differentiation, lymph node metastasis, and distant metastasis.
Figure 7
Figure 7
CAF-derived POSTN promotes PDAC cell growth and colony formation. (A) Isolation of primary CAF from fresh surgically resected PDAC tissue. Representative images of the primary CAF extraction process at 14 days and 21 days after adherent culture of tissue pieces. (B) Characterization of primary CAFs via Western blot showing FAP, α-SMA, and E-cadherin expression. P3 and P6 in (A-B) denote the passage numbers of the primary CAFs, corresponding to passages 3 and 6, respectively. (C) Western blot analysis of POSTN expression in PDAC cell lines and CAF cells. (D-E) Overexpression efficiency of POSTN in the CCC-HPE-2 cell line and knockdown efficiency of POSTN in primary CAFs analyzed by Western blot. (F) Schematic illustration of the phenotypic experimental design. (G-H) CCK-8 assays assessing BxPC-3 (G) and PANC-1 (H) proliferation after treatment with (1) control medium, (2) 40% CM from CAF-oePOSTN or pCAF-shPOSTN cells, and (3) 40% CM from CAF-NC or pCAF-NC cells. (I-J) CCK-8 assays assessing BxPC-3 and PANC-1 proliferation after treatment with rhPOSTN. (K-L) Colony formation assays evaluating BxPC-3 and PANC-1 growth under conditions similar to Figures 7G and 7H, respectively. (M-N) Colony formation assays assessing BxPC-3 and PANC-1 growth after treatment with rhPOSTN. (O-Q) Tumor growth and burden analysis in BALB/c-Nude mice injected subcutaneously with BxPC-3 cells (2 × 10⁶) mixed with CCC-HPE-2 (POSTN-OE) cells (2 × 10⁶) or CCC-HPE-2 (NC) cells (2 × 10⁶). (R) Representative IHC staining images of xenograft tumor sections stained for Ki-67 and POSTN.
Figure 8
Figure 8
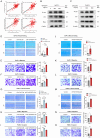
CAF-derived POSTN induces EMT, migration, and invasion of PDAC cells. (A) Correlation analysis between POSTN mRNA expression and EMT markers (VIM, SNAI1, ZEB1, SNAI2) in the TCGA-PAAD dataset. (B-C) Western blot analysis of EMT markers (N-cadherin, vimentin, and slug) in BxPC-3 and PANC-1 cells treated with rhPOSTN at indicated concentrations for 24 hours. (D-F) Cellular wound healing, migration, and invasion assays for BxPC-3 cells under conditions similar to Figure 7G. (G-I) Cellular wound healing, migration, and invasion assays for PANC-1 cells under conditions similar to Figure 7H. (J-O) Wound healing and transwell assays evaluating migration and invasion ability of BxPC-3 and PANC-1 cells treated with varying concentrations of rhPOSTN.
Figure 9
Figure 9
CAF-derived POSTN induces the translation to EMT-subtype via PI3K/AKT/β-catenin signaling in PDAC Cells. (A) Differential gene expression analysis of ductal cells based on fibroblast-derived POSTN levels. Tumor samples from the CRA001160 dataset were classified into high- and low- POSTN groups (75th percentile cutoff), and ductal cell gene expression profiles were compared to identify differences linked to CAF-derived POSTN. (B) GSEA of upregulated genes in ductal cells from POSTN-high samples identified enriched KEGG pathways. (C-F) GSEA of upregulated genes revealed enrichment in the EMT pathway, focal adhesion pathway, PI3K-AKT pathway, and WNT pathway. (G-H) Western blot analysis of β-catenin expression, and phosphorylation of FAK, AKT, and GSK-3β in BxPC-3 and PANC-1 cells after 24-hour treatment with rhPOSTN at varying concentrations. (I) Schematic illustration of how CAF-derived POSTN drives the EMT phenotype in PDAC cells via integrin αvβ5/FAK/PI3K/AKT/β-catenin signaling pathway.
Figure 10
Figure 10
Integrin αvβ5 inhibitors partially reverse POSTN-induced proliferation, colony formation, migration, and invasion of PDAC cells. (A) Co-localization of POSTN and intergrin β5 in PDAC tissues. Immunofluorescence staining showing POSTN (green), integrin β5 (red), and nuclei (blue) in PDAC patient resection specimens. Scale bars, 25 μm. (B-C) Effect of integrin αvβ5 inhibition on POSTN-induced proliferation in BxPC-3 and PANC-1 cells. Cells were treated with: (1) negative control, (2) 500 ng/mL rhPOSTN, (3) integrin αvβ5 inhibitor (HY-16141) at 1/5 IC50 concentration, or (4) integrin αvβ5 inhibitor pretreated for 24 hours, followed by 500 ng/mL rhPOSTN. Cell proliferation was assessed using CCK-8 assays. (D) Colony formation assays in BxPC-3 and PANC-1 cells following the same treatments as in (B-C). (E-F) Wound healing assays in BxPC-3 and PANC-1 cells after treatments as described in (B-C), assessing migration capacity. (G-H) Transwell assays in BxPC-3 and PANC-1 cells to assess migation (G) and invasion (H) under the same treatment as in (B-C). (I) Western blot analysis of β-catenin expression, and phosphorylation of FAK, AKT, and GSK-3β in BxPC-3 and PANC-1 cells after 24-hour treatment as described in (B-C).

Similar articles

References

    1. Siegel RL, Giaquinto AN, Jemal A. Cancer statistics, 2024. CA: a cancer journal for clinicians. 2024;74:12–49. - PubMed
    1. Kleeff J, Korc M, Apte M, La Vecchia C, Johnson CD, Biankin AV. et al. Pancreatic cancer. Nature reviews Disease primers. 2016;2:16022. - PubMed
    1. Chhabra Y, Weeraratna AT. Fibroblasts in cancer: Unity in heterogeneity. Cell. 2023;186:1580–609. - PMC - PubMed
    1. Luo H, Xia X, Huang L-B, An H, Cao M, Kim GD. et al. Pan-cancer single-cell analysis reveals the heterogeneity and plasticity of cancer-associated fibroblasts in the tumor microenvironment. Nature communications. 2022;13:6619. - PMC - PubMed
    1. Li X, Sun Z, Peng G, Xiao Y, Guo J, Wu B. et al. Single-cell RNA sequencing reveals a pro-invasive cancer-associated fibroblast subgroup associated with poor clinical outcomes in patients with gastric cancer. Theranostics. 2022;12:620–38. - PMC - PubMed

MeSH terms

Substances