. 2025 May 31;21(8):3705-3725.
doi: 10.7150/ijbs.105550. eCollection 2025.

ITLN1 exacerbates Crohn's colitis by driving ZBP1-dependent PANoptosis in intestinal epithelial cells through antagonizing TRIM8-mediated CAPN2 ubiquitination

Affiliations

ITLN1 exacerbates Crohn's colitis by driving ZBP1-dependent PANoptosis in intestinal epithelial cells through antagonizing TRIM8-mediated CAPN2 ubiquitination

Jie Zhao et al. Int J Biol Sci. .

Abstract

Background: This study aimed to investigate the mechanisms by which PANoptosis of intestinal epithelial cells (IECs) promotes Crohn's disease (CD) progression. Methods: Single-cell RNA sequencing (scRNA-seq) was performed on inflamed and uninflamed colon tissues from patients with CD. The biological functions of intelectin-1 (ITLN1) in inflammation and PANoptosis were verified through in vitro experiments. The molecular mechanisms underlying its biological functions were examined using co-immunoprecipitation (Co-IP) combined with mass spectrometry (MS) and RNA-seq and further validated with rescue experiments. Additionally, the in vivo function of ITLN1 regulation on inflammation, PANoptosis, and the intestinal mucosal barrier was explored in interleukin-10 knockout (IL-10 KO) colitis model mice. Results: ITLN1 was significantly overexpressed in IECs from inflamed colon tissues and specifically associated with CD-related inflammatory markers. RNA-seq and in vitro experiments indicated that ITLN1 promotes inflammation, PANoptosis, and impaired tight junctions. Co-IP and MS analyses revealed that ITLN1 can bind to the PANoptosis-promoting protein calpain-2 (CAPN2) and enhance its stability. The E3 ubiquitin ligase, a tripartite motif containing 8 (TRIM8), directly interacts with CAPN2 and mediates its ubiquitination degradation. ITLN1 can bind to TRIM8, and its impact on inflammation and Z-DNA binding protein 1 (ZBP1)-induced PANoptosis can be antagonized by CAPN2. These in vivo studies indicated that short hairpin-ITLN1 improves colonic inflammation and intestinal barrier function in IL-10 KO mice. Conclusion: We identified the ITLN1-TRIM8-CAPN2 axis that drives IEC PANoptosis in CD progression. Pharmacological inhibition of ITLN1 significantly mitigated epithelial damage and colitis both in vivo and in vitro, establishing ITLN1-targeted therapies and PANoptosis modulation as viable clinical strategies for CD treatment.

Keywords: Crohn's disease; ITLN1/TRIM8/CAPN2 axis; PANoptosis; ubiquitination.


Conflict of interest statement

Competing Interests: The authors have declared that no competing interest exists.

Figures
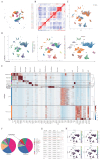
Figure 1
Figure 1
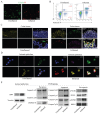
Single-cell RNA sequencing analysis of inflamed and uninflamed colon tissues from patients with CD. (A) Three-dimensional projection of cell clustering in the colon was performed using the UMAP method. (B) Heatmap illustrating the correlation between different cell populations, calculated by Pearson's correlation coefficients. (C) Clustering analysis of cells derived from inflamed and uninflamed colon tissues, highlighting distinct cell groupings. (D) UMAP-based cell type annotation, illustrating various cell types in the colon tissue samples. (E) Expression levels of marker genes across each cell cluster. (F-G) Comparative analysis of cell subgroup distributions between inflamed and uninflamed tissues, indicating statistical significance. (H) Expression profiles of specific IEC marker genes across various cell clusters. IECs, intestinal epithelial cells; CD, Crohn's disease; UMAP, Uniform Manifold Approximation and Projection.
Figure 2
Figure 2
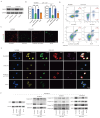
Evidence of PANoptosis in CD under inflammatory conditions. (A) Live/dead cell staining (Calcein/PI) of primary isolated IECs from inflamed and uninflamed colon tissues, illustrating viable (green) and dead (red) cells. Scale bar: 100 μm. (B) FCM analysis of apoptosis with Annexin V/PI staining in primary isolated IECs from inflamed and uninflamed colon tissues. (C) Immunofluorescence analysis of PANoptosis-related marker genes (caspase1, RIPK3, ZBP1, and ASC) in inflamed versus uninflamed regions of colon tissues. Scale bars: 100 and 20 μm. (D) Immunofluorescence detection of PANoptosis-related marker genes (caspase1, RIPK3, ZBP1, and ASC) in isolated IECs from inflamed and uninflamed colon tissues. Scale bar: 20 μm. (E) Western blotting analysis for PANoptosis-related marker genes (caspase1, caspase3, caspase7, GSDMD-N, MLKL, and RIPK3) in isolated IECs from inflamed and uninflamed colon tissues. IECs, intestinal epithelial cells; CD, Crohn's disease; FCM, flow cytometry.
Figure 3
Figure 3
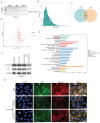
ITLN1 in IECs closely correlates with CD inflammation. (A) Heatmap and (B) volcano plot displaying differentially expressed genes in IECs from inflamed and uninflamed colon tissues of patients with CD (threshold: FC > 1.5 and adjusted P value < 0.05). (C) qRT-PCR validation of differentially expressed genes in the isolated epithelium (10 inflamed versus 10 uninflamed), confirming the upregulation of ITLN1, IGHG3, and HMGCS2 in the inflamed epithelium. (D-F) Correlation analysis between ITLN1, IGHG3, and HMGCS2 expression in inflamed epithelium with CD-associated inflammatory markers (CRP, CDAI, and SES-CD), demonstrating significant associations. (G) Relative mRNA expression of ITLN1 in various WT mice tissues, exhibiting its highest expression in the gastrointestinal system. (H) RNA and protein expression of ITLN1 in human tissues, as provided by the Atlas online database. (I) Western blotting analysis of ITLN1 protein expression in IECs from inflamed and uninflamed colon tissues of patients with CD, highlighting the elevated expression in inflamed IECs. CD, Crohn's disease; IECs, intestinal epithelial cells; ITLN1, intelectin-1; FC, fold change; qRT-PCR, quantitative real-time-polymerase chain reaction; CRP, C-reactive protein; CDAI, Crohn's disease activity index; SES-CD, simple endoscopic score for Crohn's disease. Data are presented as mean ± standard deviation (SD). ** P < 0.01, *** P < 0.001, **** P < 0.0001 by paired t test.
Figure 4
Figure 4
ITLN1 influences PANoptosis in IECs. (A) Western blotting and (B) q-PCR analysis revealing ITLN1 expressions in NCM460 cells with or without LPS/ATP stimulation. (C-D) The heatmap and volcano plots illustrating differentially expressed genes from RNA-seq analysis comparing sh-ITLN1 versus sh-control. (E) KEGG pathway enrichment analysis of differentially expressed genes. (F) Effect of various cell death inhibitors on cell viability in LPS/ATP-induced NCM460 cells. (G) Annexin V/PI FCM analysis of apoptosis in LPS/ATP-induced NCM460 cells treated with sh-ITLN1 or control. (H) Live/dead cell staining (Calcein/PI) of LPS/ATP-induced NCM460 cells, visualizing viable (green) and dead (red) cells. Scale bar: 100 μm. (I) Influence of sh-ITLN1 or control on the proinflammatory cytokine levels in LPS/ATP-induced NCM460 cells. (J) Western blotting analysis for PANoptosis-related marker genes (caspase-1, caspase-3, GSDMD-N, MLKL, RIPK3) in LPS/ATP-induced NCM460 cells. ITLN1, Intelectin-1; IECs, intestinal epithelial cells; LPS, lipopolysaccharide; ATP, adenosine triphosphate; FCM, flow cytometry. ** P < 0.01, *** P < 0.001, **** P < 0.0001 by paired t test.
Figure 5
Figure 5
ITLN1 influences tight junctions in IECs. (A) Western blotting analysis following ITLN1 immunoprecipitation, confirming the presence of ITLN1 in the immunoprecipitated complex. (B) Distribution of peptide lengths obtained from mass spectrometry after immunoprecipitation, illustrating the size distribution of peptides associated with ITLN1. (C) Venn diagram displaying the overlap of proteins between ITLN1 and IgG immunoprecipitations. (D) Volcano plot of differentially expressed proteins (threshold: FC > 2, P < 0.05). (E) KEGG pathway analysis of differentially expressed proteins. (F) Western blotting analysis illustrating the effect of sh-ITLN1 on the expression of tight junction proteins (occludin and ZO-1) in NCM460 cells with or without LPS/ATP. (G) Immunofluorescence images illustrating the localization and expression of tight junction proteins (occludin and ZO-1) in IECs, with the impact of sh-ITLN1 treatment, indicating disruption of tight junction integrity. Scale bar: 20 μm. CD, Crohn's disease; IECs, intestinal epithelial cells; ITLN1, intelectin-1; DEGs, differentially expressed genes; LPS, lipopolysaccharide; ATP, adenosine triphosphate; FC, fold change; FCM, flow cytometry; KEGG, Kyoto encyclopedia of genes and genomes. Data are presented as mean ± SD. ** P < 0.01, *** P < 0.001, **** P < 0.0001 by one-way ANOVA test.
Figure 6
Figure 6
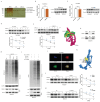
ITLN1 regulates CAPN2 ubiquitination through competitive binding with TRIM8. (A) Silver staining analysis of ITLN1 IP, identifying interacting proteins. (B) mRNA and protein expression levels of CAPN2 in isolated IECs from inflamed and uninflamed colon tissues illustrating no significant change. (C) Impact of sh-ITLN1 on CAPN2 mRNA and protein expression levels in NCM460 cell lines. (D) CHX protein stability assay evaluating the impact of ITLN1 on the stability of CAPN2 protein over time in NCM460 cells. (E) CHX protein stability assay evaluating the stability of CAPN2 protein over time in HEK293 cells. (F) Computational molecular docking analysis identifying potential binding sites between TRIM8 and CAPN2. (G) Bidirectional Co-IP between CAPN2 and TRIM8, confirming their direct interaction. (H) Endogenous and (I) exogenous assessments of TRIM8's impact on the ubiquitination level of CAPN2 protein in HEK293 cells using ubiquitin immunoblotting. (J) Immunofluorescence co-localization of ITLN1 and TRIM8 in NCM460 cells, confirming their spatial proximity. (K) Computational molecular docking analysis revealing potential binding sites between TRIM8 and ITLN1. (L-M) CHX protein stability assay evaluating the impact of TRIM8 and si-TRIM8 on the degradation of the CAPN2 protein in HEK293 cells. IECs, intestinal epithelial cells; IP, immunoprecipitation; ITLN1, intelectin-1; CAPN2, calpain-2; TRIM8, tripartite motif containing 8; CHX, cycloheximide. Data are presented as mean ± SD. ** P < 0.01, *** P < 0.001, **** P < 0.0001 by unpaired t test.
Figure 7
Figure 7
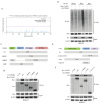
CAPN2 interacts with TRIM8. (A) The predicted ubiquitination sites of CAPN2 determined by Prop1.0, illustrating potential propeptide cleavage regions. (B) Immunoblot analysis of lysates from HEK293 cells transfected with His-tagged K48-Ub or K63-Ub, indicating the ubiquitination pattern of Myc-tagged CAPN2 in the presence or absence of HA-tagged TRIM8. (C) Schematic diagram of TRIM8 and its truncation mutants. (D) Immunoprecipitation of HA-tagged TRIM8 or its mutants and Myc-tagged CAPN2 in HEK293 cells, followed by immunoblotting with the indicated antibodies to analyze their interaction. (E) Schematic diagram of CAPN2 and its truncation mutants. (F) Immunoprecipitation of Myc-tagged CAPN2 or its mutants and HA-tagged TRIM8 in HEK293 cells, followed by immunoblotting to assess the interaction between the proteins.
Figure 8
Figure 8
CAPN2 antagonizes the effects of ITLN1 on inflammation and ZBP1-induced PANoptosis. (A) Western blotting analysis illustrating the effect of sh-ITLN1 and CAPN2 rescue on CAPN2 protein expression in NCM460 cells, confirming the modulation of CAPN2 expression upon sh-ITLN1 and CAPN2 rescue treatment. (B) ELISA quantification of proinflammatory cytokines (IL-6 and IL-8) in NCM460 cells, demonstrating the influence of sh-ITLN1 and CAPN2 rescue on cytokine levels following LPS/ATP co-stimulation. (C) Live/dead (Calcein/PI) staining of NCM460 cells indicating the effect of sh-ITLN1 and CAPN2 rescue on cell viability. Scale bar: 100 μm. (D) Flow cytometry analysis of apoptosis in LPS/ATP co-stimulated NCM460 cells treated with sh-ITLN1, sh-ITLN1 + CAPN2 rescue, or ALLN. (E) Immunofluorescence analysis of PANoptosis-related marker genes (caspase-1, RIPK3, ZBP1, and ASC) in NCM460 cells, illustrating the effect of sh-ITLN1 and CAPN2 rescue on PANoptosis expression. Scale bar: 20 μm. (F) Western blotting analysis of PANoptosis-related proteins (caspase-1, caspase-3, caspase-7, GSDMD-N, p-MLKL, p-RIPK3) in LPS/ATP co-stimulated NCM460 cells, indicating the modulation of PANoptosis pathways by sh-ITLN1 and CAPN2 rescue. IECs, intestinal epithelial cells; ITLN1, intelectin-1; CAPN2, calpain-2; FCM, flow cytometry; LPS, lipopolysaccharide; ATP, adenosine triphosphate. Data are presented as mean ± SD. *** P < 0.001 by one-way ANOVA test.
Figure 9
Figure 9
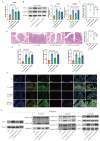
Sh-ITLN1 alleviates colonic inflammation in IL-10 KO mice. (A) Effect of sh-ITLN1 and CAPN2 rescue on ITLN1 mRNA levels in colon tissues of mice, illustrating a significant reduction in ITLN1 expression upon sh-ITLN1 treatment. (B) Western blotting analysis revealing the impact of sh-ITLN1 on ITLN1 and CAPN2 protein expression in colon tissues from IL-10 KO mice. (C) Effect of sh-ITLN1 on the disease activity index, indicating a significant reduction in disease severity in the IL-10 KO model upon ITLN1 knockdown. (D) Histological analysis of colon tissues using HE staining, revealing the influence of sh-ITLN1 on the pathological inflammation score. Scale bar: 20 μm. (E) Quantification of inflammatory cytokine levels (TNF-α, IFN-γ, and IL-17) in colon tissues, demonstrating a significant decrease following sh-ITLN1 treatment. (F) Immunofluorescence and (G) Western blotting analysis of PANoptosis-associated marker genes in colon tissues, demonstrating the effect of sh-ITLN1 and CAPN2 rescue on PANoptosis level. Scale bar: 20 μm. ITLN1, intelectin-1; CAPN2, calpain-2; IL-10 KO, IL-10 knock-out. Data are presented as mean ± SD. ** P < 0.01, *** P < 0.001 by one-way ANOVA test.
Figure 10
Figure 10
Sh-ITLN1 enhances intestinal barrier function in IL-10 KO mice. (A) Mannitol fluxes, (B) electrical resistance, and (C) FITC-dextran analyses evaluating the effect of sh-ITLN1 and CAPN2 restoration on intestinal permeability. (D) Western blotting and (E) immunofluorescence analysis (scale bar: 100 and 20 μm) illustrating the effect of sh-ITLN1 and CAPN2 rescue on tight junction proteins (occludin and ZO-1) in colon tissues. (F) MUC2 immunohistochemistry in colon tissues. (scale bar: 50 and 20 μm). (G) AB-PAS staining in colon tissues (scale bar: 100 and 20 μm). (H) TUNEL staining in colon tissues (scale bar: 100 μm). (I) Representative TEM images of tight junctions in each group (scale bar: 1 μm). ITLN1, intelectin-1; CAPN2, calpain-2; IL-10 KO, IL-10 knockout; FITC, fluorescein isothiocyanate; TJ, tight junction; AB-PAS, Alcian Blue-Periodic Acid-Schiff; TEM, transmission electron microscope; TUNEL, terminal deoxynucleotidyl transferase dUTP nick end labeling. Data are presented as mean ± SD. * P < 0.05, ** P < 0.01, *** P < 0.001 by one-way ANOVA test.
Figure 11
Figure 11
A schematic diagram illustrating how ITLN1 promotes Crohn's colitis by inducing PANoptosis. IECs, intestinal epithelial cells; ITLN1, intelectin-1; CAPN2, calpain-2; TRIM8, tripartite motif containing 8.

References

    1. Roda G, Chien Ng S, Kotze PG. et al. Crohn's disease. Nat Rev Dis Primers. 2020;6:22. - PubMed
    1. Ng SC, Shi HY, Hamidi N. et al. Worldwide incidence and prevalence of inflammatory bowel disease in the 21st century: a systematic review of population-based studies. Lancet. 2017;390:2769–2778. - PubMed
    1. Cui G, Liu H, Xu G. et al. Exploring Links Between Industrialization, Urbanization, and Chinese Inflammatory Bowel Disease. Front Med (Lausanne) 2021;8:757025. - PMC - PubMed
    1. Petagna L, Antonelli A, Ganini C. et al. Pathophysiology of Crohn's disease inflammation and recurrence. Biol Direct. 2020;15:23. - PMC - PubMed
    1. Caio G, Lungaro L, Caputo F. et al. Nutritional Treatment in Crohn's Disease. Nutrients. 2021;13:1628. - PMC - PubMed