. 2025 May 20;28(6):112712.
doi: 10.1016/j.isci.2025.112712. eCollection 2025 Jun 20.

The matricellular protein ADAMTS-like 2 regulates differentiation of skeletal muscle-resident fibro-adipogenic progenitor cells

Affiliations

The matricellular protein ADAMTS-like 2 regulates differentiation of skeletal muscle-resident fibro-adipogenic progenitor cells

Charlene Redhead et al. iScience. .

Abstract

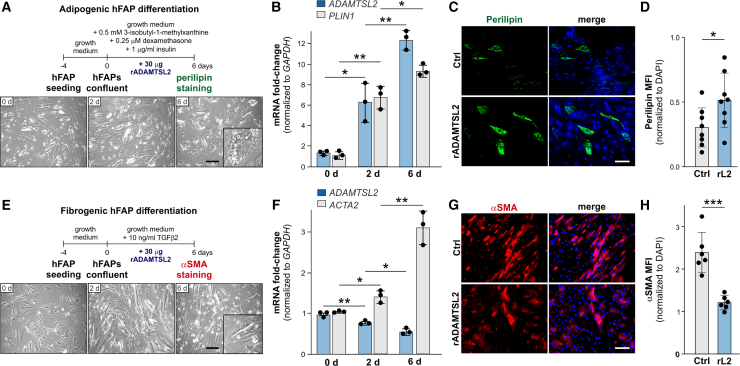
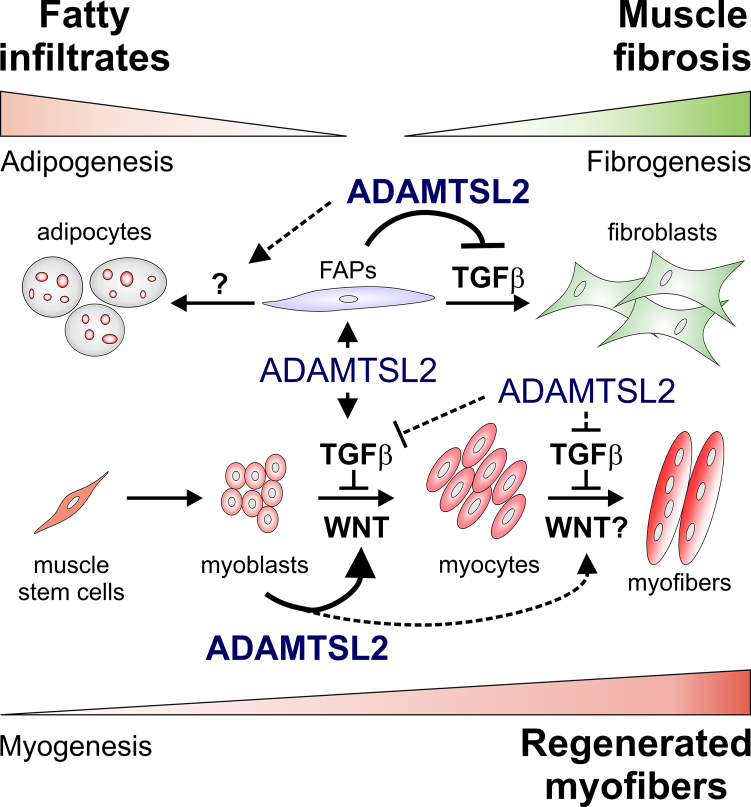
Skeletal muscle development and regeneration requires the activities of myogenic and non-myogenic muscle stem cell populations. Non-myogenic muscle stem cells, such as fibro-adipogenic progenitors (FAPs), play important roles in muscle regeneration after injury. Activated FAPs promote myogenic muscle stem cell differentiation and contribute to the restoration of muscle architecture. In pathological conditions, FAPs can differentiate into adipocytes or fibroblasts, causing fatty infiltrations or muscle fibrosis, respectively. Here, we identified the extracellular matrix protein ADAMTS-like 2 (ADAMTSL2) as a regulator of adipogenic and fibrogenic FAP differentiation. In the context of fibrogenic FAP differentiation, ADAMTSL2 inhibited the differentiation of primary mouse and human FAPs into fibroblasts in a transforming growth factor β (TGF-β)-dependent manner. Together with our previous data, a model emerges where ADAMTSL2 has a dual role in skeletal muscle biology, a pro-myogenic role, where ADAMTSL2 promotes myogenic muscle stem cell differentiation, and a TGF-β-dependent anti-fibrotic role where ADAMTSL2 attenuates FAP-to-fibroblast differentiation.

Keywords: Biochemistry; Cell biology; Specialized functions of cells.


Conflict of interest statement

J.H.C. and K.J.H. are employees of Cook MyoSite Inc.

Figures

None
Graphical abstract
Figure 1
Figure 1
ADAMTSL2 is expressed in FAPs but does not affect skeletal muscle development or postnatal growth (A) Single-cell transcriptomics data extracted from the Tabula muris dataset (https://tabula-muris.ds.czbiohub.org/) showing the percentage of Adamtsl2-expressing FAPs in adult mice. Total number of analyzed cells is indicated. T, T cells; End, endothelial cells; Sat, satellite cells; MΦ, macrophages; B, B cells. (B) Bar plot showing the expression of Adamtsl2 in individual cells of distinct endomysial and paramysial skeletal muscle fibroblast sub-populations. Sub-clusters based on location are indicated and numbered according to Muhl et al. (https://betsholtzlab.org/Publications/FibroblastMural/database.html). SMC, smooth muscle cells. (C) Percentage of Adamtsl2-positive cells with a count >1 from (B). Fibroblast sub-clusters with significant Adamtsl2 expression are highlighted in blue and the total number of analyzed cells per sub-cluster is indicated. Sub-cluster are numbered according to the legend in (B). (D) Schematic showing the generation of mice with muscle connective tissue cell-specific inactivation of Adamtsl2. Note that Prx1-Cre deletes ADAMTSL2 also in other limb bud-derived tissues, such as bone and cartilage but not in myogenic progenitor cells. (E) Mid-belly cross-sections of the TA from Ctrl and CKO-Prx mice stained with an ADAMTSL2 peptide antibody. Nuclei were counterstained with DAPI. (F) Wet weight of Ctrl and CKO-Prx extensor digitorum longus (EDL), gastrocnemius (GM), and TA muscle normalized to body weight (n = 7 mice, 2 fields of view). (G) Mid-belly cross-sections of the TA from Ctrl and CKO-Prx mice stained for the basement membrane component laminin, which outlines myofibers. Nuclei were counterstained with DAPI. (H) Violin plot of myofiber cross-sectional areas (CSA) from (G). n = 768 (Ctrl) and n = 708 (CKO-Prx) myofibers from n = 3 mice were analyzed. Scale bars in (E) and (H) represent 50 μm. Data are represented as mean ± SD. Statistical significance in (F), (G), and (I), was calculated with a two-sided Student’s t test, ∗∗p < 0.01 and ∗∗∗p < 0.001.
Figure 2
Figure 2
ADAMTSL2 in FAPs impacts muscle regeneration after volumetric muscle loss (VML) (A) Surgical approach using a 2 mm biopsy punch resulting in full-thickness VML to the mid-belly section of the TA. (B) Schematic depicting analysis time points post-VML injury. (C) Laminin and embryonic myosin heavy chain (eMyHC) staining at 7 dpi in VML-injured TA compared to contralateral uninjured TA of WT mice showing significant muscle regeneration activity in the injured TA only. (D) Laminin and eMyHC staining of VML-injured CKO-Prx and Ctrl TA at 7 dpi. Nuclei were counterstained with DAPI. (E) Quantification of eMyHC signal intensity from (D) (n = 4 mice, 2 fields of view). (F) Laminin of VML-injured CKO-Prx and Ctrl TA at 28 dpi. Nuclei were counterstained with DAPI. (G) Quantification of myofiber cross-sectional area (CSA) from F (n = 456 (Ctrl) and n = 724 (KO-Prx) myofibers were analyzed). (H) Quantification of the percentage of myofibers with centrally located nuclei, indicating regenerated myofibers (n = 3 mice, 2 fields of view). Scale bars in (C), (D), and (F) represent 50 μm. Data are represented as mean ± SD. Statistical significance in (E), (G), and (H) was calculated with a two-sided Student’s t test, ∗p < 0.05 and ∗∗∗p < 0.001.
Figure 3
Figure 3
FAP isolation and phenotypes of ADAMTSL2-deficient FAPs (A) Schematic of the magnetic activated cell sorting (MACS)-based FAP purification protocol. (B) PDGFRα immunostaining showing purity of FAP preparation from wild-type mice. Nuclei were counterstained with DAPI. (C) Adamtsl2 mRNA quantification in Ctrl and CKO-Prx FAPs after 4 days of fibrogenic differentiation. Adamtsl2 mRNA levels were normalized to Gapdh and Ctrl. (D) Western blot analysis of ADAMTSL2 protein in cell lysates from Ctrl and CKO-Prx FAPs. (E) Quantification of ADAMTSL2 band intensity in D normalized to GAPDH and Ctrl (n = 3 independent FAP preparations). (F) Western blot analysis of ADAMTSL2 protein in cell lysates from primary Ctrl and CKO-Prx myoblasts isolated via pre-plating. (G) Ki67 immunostaining identifies proliferating FAPs isolated from Ctrl or CKO-Prx. Nuclei were counterstained with DAPI. (H) Quantification of percentage of proliferating Ki67+ cells from (G). n = 6 fields of view from n = 1 FAP isolate. (I) Schematic depicting the setup of the FAP/C2C12 myoblast co-culture system. (J) Visualization of multinucleated myotubes by immunostaining for myosin heavy chain (MyHC) and DAPI staining for nuclei. sh-Adamtsl2-expressing C2C12 myoblasts were co-cultured with Ctrl or CKO-Prx FAPs. sh-Ctrl and sh-Adamtsl2 treated C2C12 myoblasts in single cultures served as controls for myotube formation and the effect of ADAMTSL2-depletion in myoblast differentiation as reported previously. (K) Quantification of fusion index, i.e., the percentage of nuclei in multinucleated myotubes, from (J). n = 3 co-cultures. Scale bars in (B), (G), and (J) represent 50 μm. Data are represented as mean ± SD. Statistical significance in (C), (E), and (H) was calculated with a two-sided Student’s t test and in (K) with a one-way ANOVA with posthoc-Tukey test. ∗p < 0.05 and ∗∗∗p < 0.001.
Figure 4
Figure 4
ADAMTSL2 limits fibrogenic FAP differentiation in a TGF-β signaling-dependent manner (A) Diagram of adipogenic FAP differentiation. (B) Perilipin immunostaining of differentiated Ctrl and CKO-Prx FAPs. Nuclei were counterstained with DAPI. (C) Quantification of perilipin mean fluorescence intensity (MFI) from (B). n = 3 independent FAP isolates. (D) Diagram of TGF-β2-induced fibrogenic FAP differentiation. (E) Α-smooth muscle actin (αSMA) immunostaining of differentiated Ctrl and CKO-Prx FAPs. Nuclei were counterstained with DAPI. (F) Quantification of αSMA MFI from (E). n = 3 independent FAP isolates. (G) Western blot analysis of αSMA protein in cell lysates from Ctrl and CKO-Prx FAPs. (H) Quantification of αSMA band intensity from G normalized to GAPDH and Ctrl (n = 5). (I) Acta2 and Col1a1 mRNA quantification in Ctrl FAPs after 4 days of fibrogenic differentiation in the presence of 100 mg/mL recombinant ADAMTSL2 (rL2). mRNA levels were normalized to Gapdh and PBS treated Ctrl FAPs. (J) Diagram of spontaneous fibrogenic FAP differentiation. (K) αSMA immunostaining of differentiated Ctrl and CKO-Prx FAPs. Nuclei were counterstained with DAPI. (L) Quantification of αSMA MFI from (K). n = 3 independent FAP isolates. (M) Acta2 mRNA quantification in Ctrl and CKO-Prx FAPs after 4 days of spontaneous fibrogenic differentiation. mRNA levels were normalized to Gapdh and Ctrl FAPs. (N) Western blot analysis of phosphorylated SMAD2 protein (pSMAD2) in cell lysates from Ctrl and CKO-Prx FAPs undergoing spontaneous fibrogenic differentiation. (O) Quantification of pSMAD2 band intensity from N normalized to GAPDH and Ctrl (n = 3). (P) αSMA immunostaining of spontaneously differentiated Ctrl and CKO-Prx FAPs after treatment with vehicle (DMSO) or 5 μm SB431542, a potent TGF-β type I receptor inhibitor. Nuclei were counterstained with DAPI. (Q) Quantification of αSMA MFI from (P). n = 3 independent FAP isolates. (R) Collagen type I immunostaining of spontaneously differentiated Ctrl and CKO-Prx FAPs. Nuclei were counterstained with DAPI. (S) Quantification of collagen type I MFI from (R). n = 3–4 independent FAP isolates. (T) Col1a1 mRNA quantification in Ctrl and CKO-Prx FAPs after 4 days of spontaneous fibrogenic differentiation. mRNA levels were normalized to Gapdh and Ctrl FAPs. Scale bars in (B), (E), (K), (P), and (R) represent 100 μm. Data are represented as mean ± SD. Statistical significance in (C), (F), (H), (I), (L), (M), (O), (S), and (T) was calculated with a two-sided Student’s t test and in (Q) with a one-way ANOVA with posthoc-Tukey test. ∗∗p < 0.01 and ∗∗∗p < 0.001.
Figure 5
Figure 5
Adipogenic and fibrogenic differentiation of human FAPs (hFAPs) is regulated by recombinant ADAMTSL2 (A) Top: diagram of adipogenic hFAP differentiation. Bottom: brightfield images of hFAPs undergoing adipogenic differentiation. Inset shows an adipocyte with lipid droplets. (B) Relative quantification of ADAMTSL2 and perilipin (PLIN1) mRNA isolated from hFAPs undergoing adipogenic differentiation. The fold-change after normalization to GAPDH expression is shown (n = 3). (C) Perilipin immunostaining of hFAPs differentiated in the presence or absence of 30 μg (100 μg/mL) exogenous recombinant ADAMTSL2 (rL2) protein. Nuclei were counterstained with DAPI. (D) Quantification of perilipin MFI from (C). 2 fields of view from n = 4 wells per FAP isolate were analyzed. (E) Top: diagram of fibrogenic hFAP differentiation. Bottom: brightfield images of hFAPs undergoing fibrogenic differentiation. Inset shows elongated fibroblast-like cell morphology. (F) Relative quantification of ADAMTSL2 and ACTA2 (aSMA) mRNA isolated from hFAPs undergoing fibrogenic differentiation. The fold-change after normalization to GAPDH expression is shown (n = 3). (G) aSMA immunostaining of hFAPs differentiated in the presence or absence of 30 μg (100 μg/mL) exogenous recombinant ADAMTSL2 (rL2) protein. Nuclei were counterstained with DAPI. (H) Quantification of αSMA MFI from (G). 2 fields of view from n = 4 wells per FAP isolate were analyzed. Scale bars in (A), (C), (E), and (G) represent 100 μm. Data are represented as mean ± SD. Statistical significance in (B) and (F) was calculated with a one-way ANOVA with posthoc-Tukey test and in (D) and (H) with a two-sided Student’s t test. ∗p < 0.05, ∗∗p < 0.01, and ∗∗∗p < 0.001.
Figure 6
Figure 6
Conceptual model for the dual role of ADAMTSL2 in skeletal muscle Bottom: by promoting the differentiation of myogenic muscle stem cells in a WNT-dependent manner, ADAMTSL2 promotes the formation of myofibers during muscle development and muscle regeneration after injury., Top: by attenuating fibrogenic differentiation of FAPs in a TGF-β-dependent manner, ADAMTSL2 prevents muscle fibrosis. The relevance of ADAMTSL2 for adipogenic FAP differentiation and the regulated signaling pathways are currently unclear. Experimentally validated ADAMTSL2 regulatory mechanisms are indicated with solid arrows/lines and proposed ADAMTSL2 regulatory mechanisms are indicated with dashed lines.

Similar articles

References

    1. Sousa-Victor P., Garcia-Prat L., Munoz-Canoves P. Control of satellite cell function in muscle regeneration and its disruption in ageing. Nat. Rev. Mol. Cell Biol. 2021;23:204–226. doi: 10.1038/s41580-021-00421-2. - DOI - PubMed
    1. Helmbacher F., Stricker S. Tissue cross talks governing limb muscle development and regeneration. Semin. Cell Dev. Biol. 2020;104:14–30. doi: 10.1016/j.semcdb.2020.05.005. - DOI - PubMed
    1. Mauro A. Satellite cell of skeletal muscle fibers. J. Biophys. Biochem. Cytol. 1961;9:493–495. doi: 10.1083/jcb.9.2.493. - DOI - PMC - PubMed
    1. Megeney L.A., Kablar B., Garrett K., Anderson J.E., Rudnicki M.A. MyoD is required for myogenic stem cell function in adult skeletal muscle. Genes Dev. 1996;10:1173–1183. doi: 10.1101/gad.10.10.1173. - DOI - PubMed
    1. Forcina L., Cosentino M., Musaro A. Mechanisms Regulating Muscle Regeneration: Insights into the Interrelated and Time-Dependent Phases of Tissue Healing. Cells. 2020;9 doi: 10.3390/cells9051297. - DOI - PMC - PubMed

LinkOut - more resources