. 2025 May 20;28(6):112707.
doi: 10.1016/j.isci.2025.112707. eCollection 2025 Jun 20.

Spatiotemporal properties of cortical excitatory and inhibitory neuron activation by sustained and bursting electrical microstimulation

Affiliations

Spatiotemporal properties of cortical excitatory and inhibitory neuron activation by sustained and bursting electrical microstimulation

Christopher L Hughes et al. iScience. .

Abstract

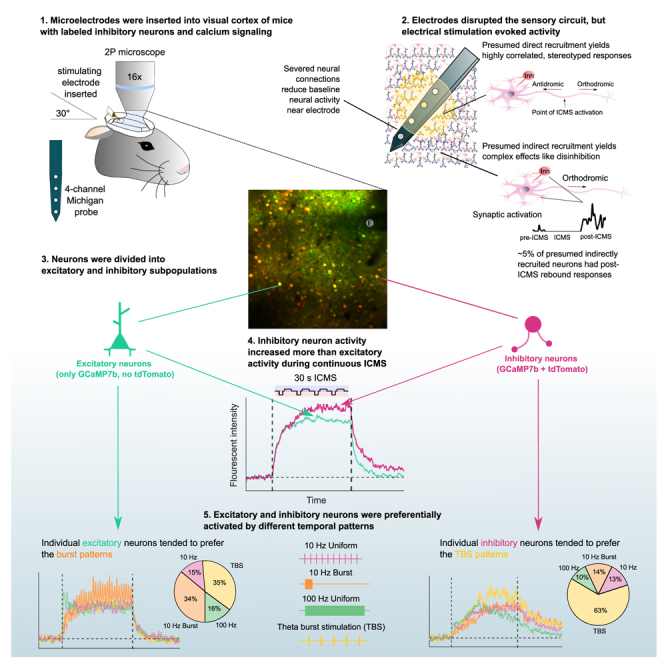
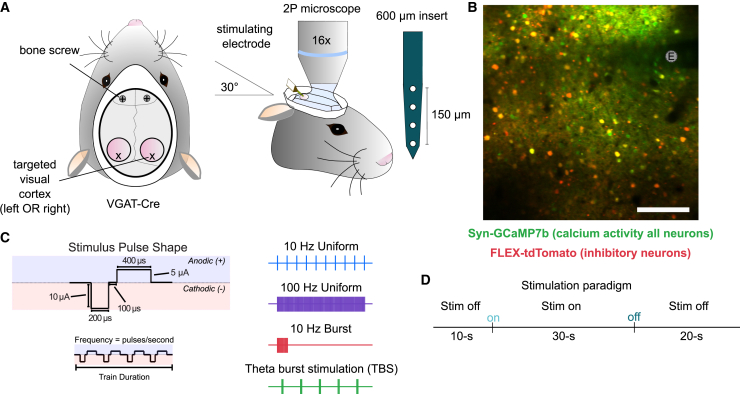
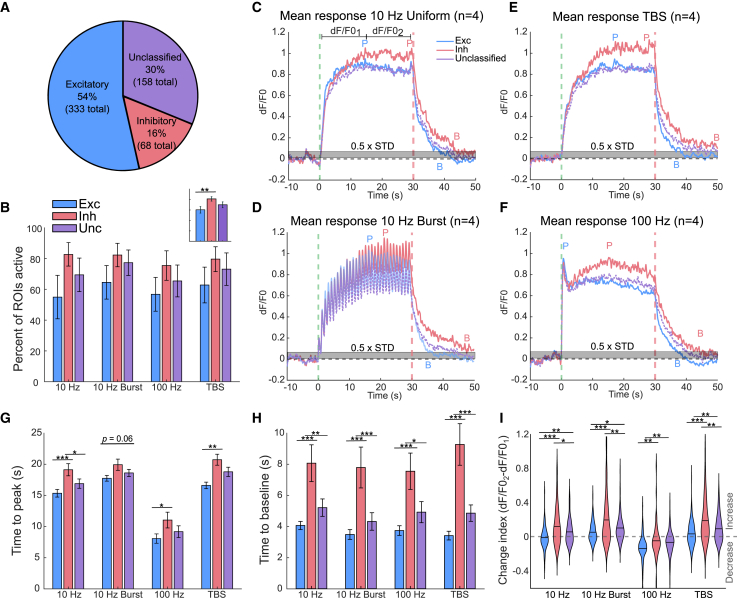
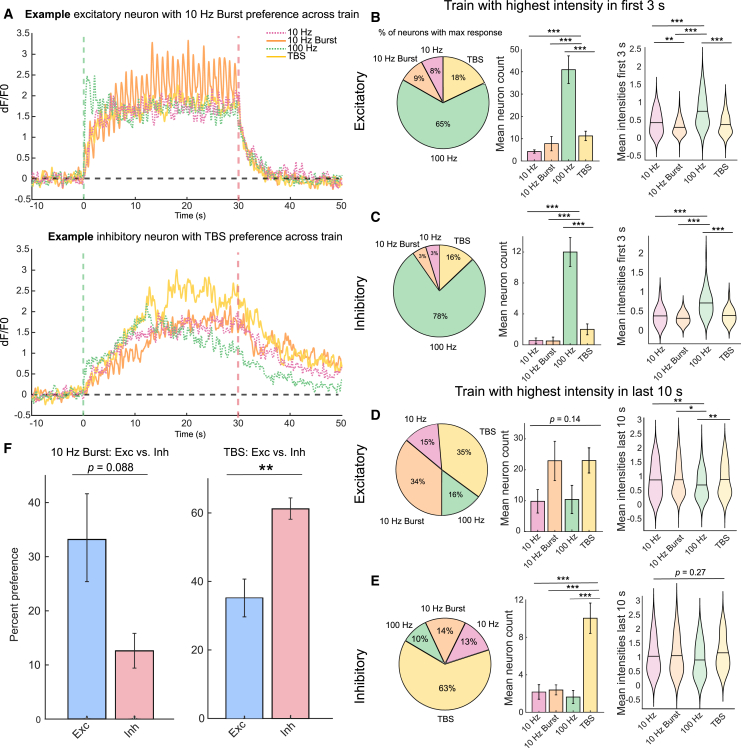
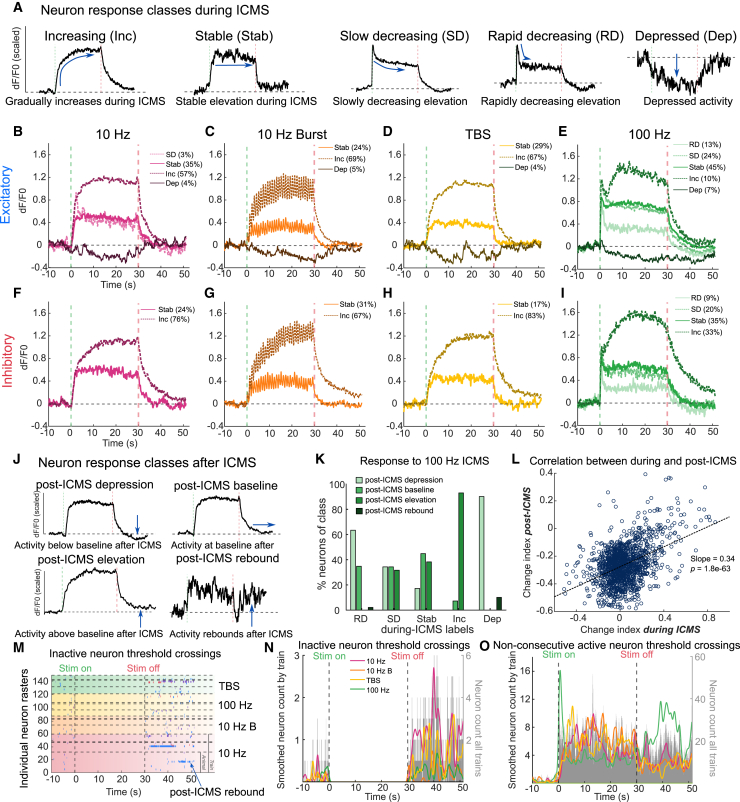
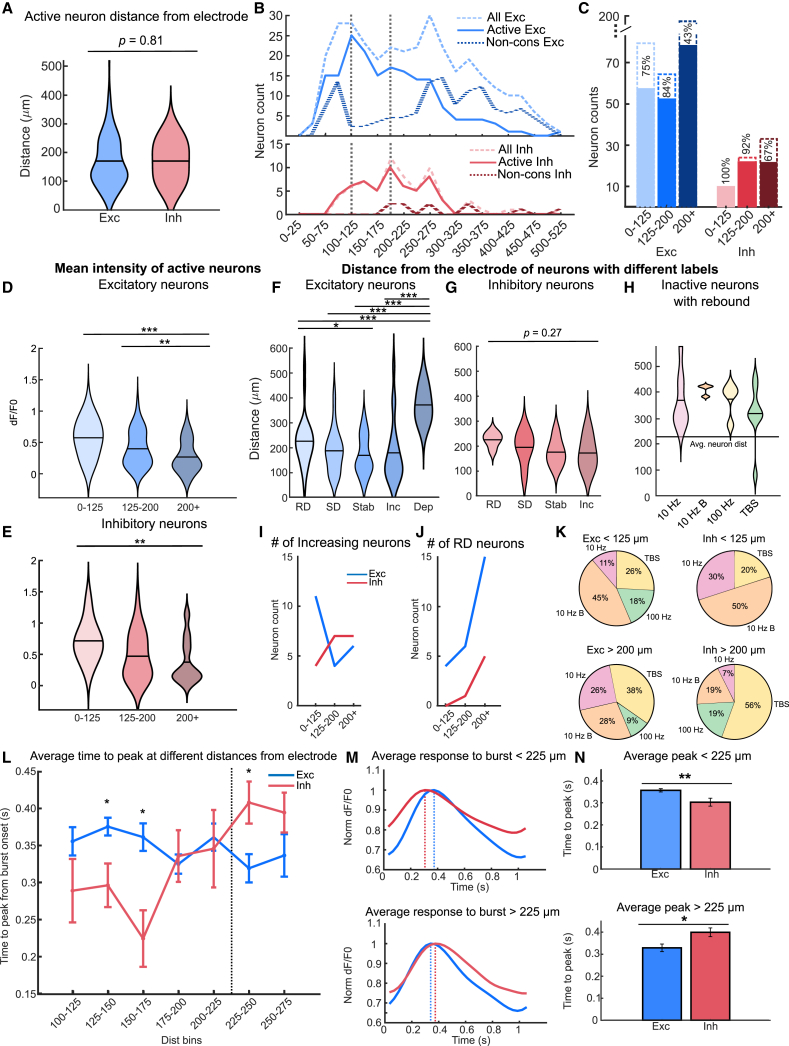
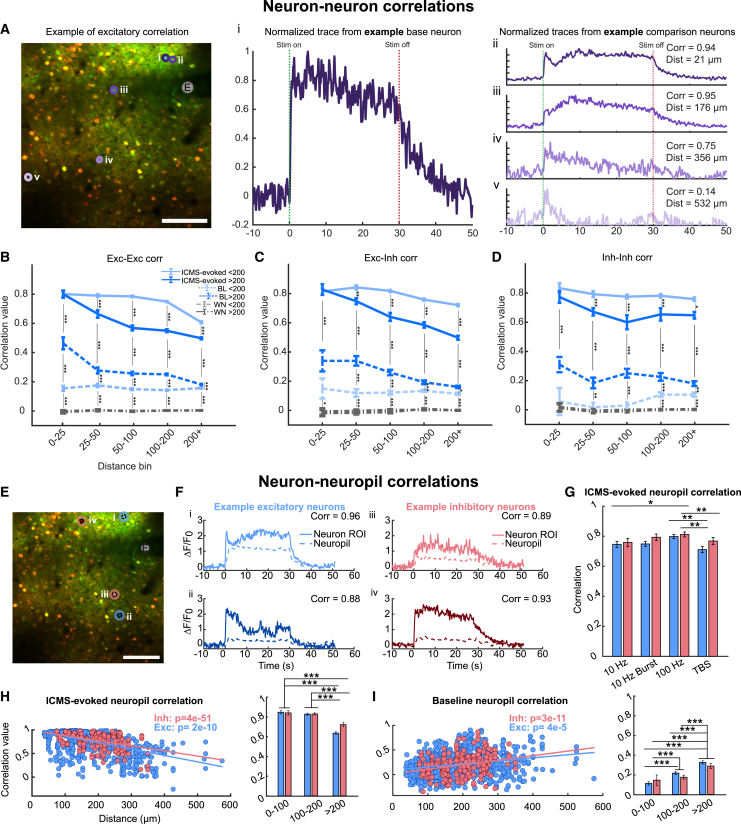
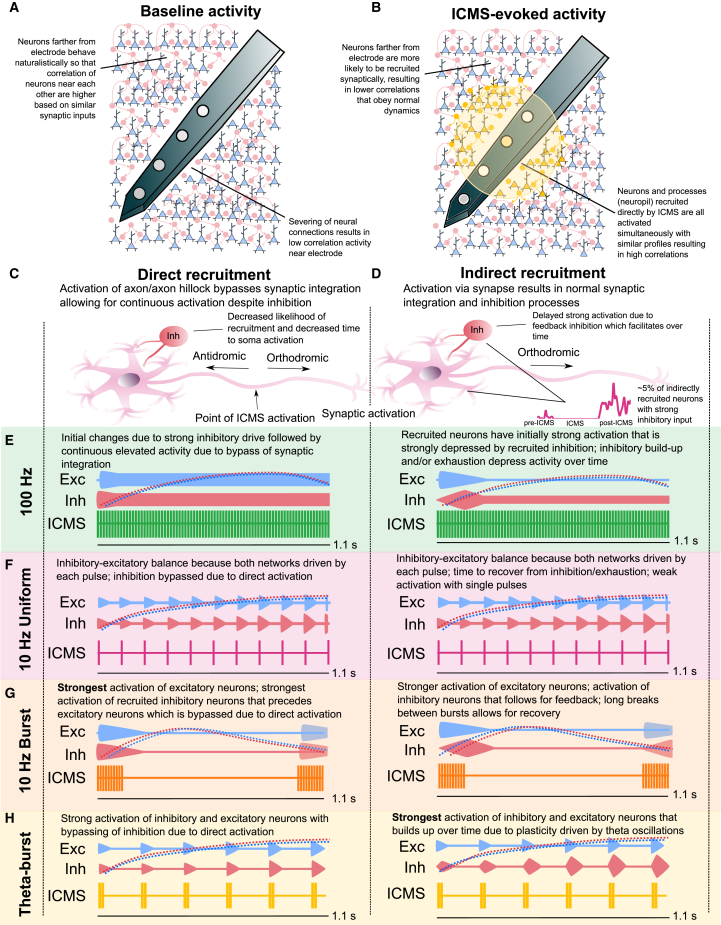
Intracortical microstimulation (ICMS) of sensory brain regions can create artificial sensations, yet these percepts fade with continued stimulation, suggesting dynamic changes in underlying neural activity. Using two-photon imaging in transgenic mice, this study examines how prolonged ICMS (30 s) shapes activity in excitatory and inhibitory neurons within the visual cortex. Inhibitory neuron activity was more likely to increase throughout the stimulation period, while excitatory neuron activity was more likely to decrease and be suppressed post-stimulation. Stimulation patterns differentially shaped neuronal engagement: theta-burst stimulation most effectively activated inhibitory neurons, whereas 10-Hz burst most effectively activated excitatory neurons. ICMS evoked more diverse responses in neurons farther from the electrode, reflecting complex synaptic interactions involving inhibition and disinhibition. These results show that ICMS affects excitatory and inhibitory neurons differently over extended durations. Modulation of stimulation patterns may allow for preferential engagement of specific neuron types and shaping of cortical activity.

Keywords: Neuroscience; Sensory neuroscience.


Conflict of interest statement

The authors declare no competing interests.

Figures

None
Graphical abstract
Figure 1
Figure 1
Two-photon imaging of VGAT-Ires-Cre mouse visual cortex in response to microstimulation (A) Bilateral craniotomies were made over visual cortex of VGAT-Cre mice, then AAV-FLEX-tdTomato and AAV-Syn-GCaMP7b were injected. After >3 weeks for expression, a Michigan probe was inserted into an area of expression on the left or right side of the brain while the animal was under light isoflurane anesthesia. All data collection occurred after the animal awoke. (B) Example image of VGAT-expressing neurons (red) and calcium activity from all neurons (green) around the microelectrode (E). (C) ICMS pulse shape and parameters. Four different ICMS trains were provided with different temporal profiles. Scale bar represents 100 μm. (D) Paradigm for ICMS delivery with 10 s pre-ICMS, 30 s ICMS, and 20 s post-ICMS imaging. Also see Figure S1 for distinguishing different neuron subtypes.
Figure 2
Figure 2
Inhibitory neurons have greater increases in ICMS-evoked fluorescent intensity and have slower time-to-peak and return-to-baseline than excitatory or unclassified neurons (A) The distribution of neurons labeled as excitatory (333 total), inhibitory (68 total), and unclassified (158 total). (B) Total percent of neurons active during ICMS for each subpopulation across temporal patterns. Error bars represent standard error across animals (n = 4). The inset shows the comparison of subpopulations combined across ICMS patterns, with a higher percent of inhibitory neurons active. (C–F) Mean traces of each subpopulation response to 10-Hz uniform (C), 10-Hz burst (D), TBS (E), or 100-Hz (F) ICMS. ICMS start (green vertical line), ICMS stop (red vertical line), 0.5x the standard deviation of baseline activity (gray bar), detected time-to-peak (“P”), and detected time-to-baseline (“B”) are indicated for each subpopulation. The two intervals of dF/F01 and dF/F02 represent the intervals used for calculation of the change index for fluorescent intensity in (I). (G and H) The calculated time-to-peak (G) and time-to-baseline (H) for each subpopulation shows inhibitory neurons were generally slower than excitatory or unclassified neurons. (I) The change index for each subpopulation shows less decreases/more increases in fluorescent intensity across 30 s for inhibitory neurons. Statistical significance was determined using ANOVA. Significance levels are indicated as follows: p < 0.05 = ∗, p < 0.01 = ∗∗, p < 0.001 = ∗∗∗. Also see Figure S2 for activation classification for different patterns.
Figure 3
Figure 3
TBS patterns evoke stronger activation of individual inhibitory neurons, while 10-Hz burst patterns evoke stronger activation of individual excitatory neurons (A) Examples of an individual excitatory neuron with “preference” (i.e., stronger fluorescent intensity across 30 s) to 10-Hz burst (top) and an individual inhibitory neuron with “preference” to TBS (bottom). Vertical bars represent ICMS start (green) and stop (red). (B and C) Preferential responses of excitatory (B) and inhibitory (C) neurons in the first 3 s of ICMS. Most neurons had the strongest response to 100-Hz. Pie plot shows the percent of each subpopulation with the highest intensity for each temporal pattern. Bar plots show the total neuron counts with the highest intensity for each pattern. Error bars indicate standard error across animals. Violin plots show the distribution of mean intensities across all active neurons. (D and E) Preferential responses of excitatory (D) and inhibitory (E) neurons in the last 10 s of ICMS. Excitatory neurons have strong preferences for 10-Hz burst and TBS, whereas inhibitory neurons predominantly preferred TBS. (F) Bar plots indicating preference for 10-Hz burst pattern (left) and TBS pattern (right) in the last 10 s of ICMS for excitatory vs. inhibitory neurons. Error bars represent the standard error across animals. Statistical significance was determined using ANOVA. Significance levels are indicated as follows: p < 0.05 = ∗, p < 0.01 = ∗∗, p < 0.001 = ∗∗∗.
Figure 4
Figure 4
Individual inhibitory neurons increased in fluorescent intensity more in response to ICMS than individual excitatory neurons, which correlated with less post-ICMS depression (A) Example traces showing ICMS-evoked response classes. (B–I) Average responses of each class for excitatory (B–E), and inhibitory (F–I) neurons with each of the four ICMS patterns. ICMS generally evokes stronger increasing activity within inhibitory neurons, although all subpopulations contained diverse response types. (J) Example traces showing post-ICMS response classes. (K) Decreased neurons (RD, SD) were more likely to be depressed post-ICMS, ICMS-stable neurons (Stab) were more likely to be at baseline post-ICMS, and ICMS-increased neurons (Inc) were more likely to be elevated post-ICMS. (L) Strong correlation between ICMS-induced change index and post-ICMS change index. The linear regression fit (black) is shown. The p value is reported directly and corresponds to p value for the t-statistic of the two-sided hypothesis test for the linear regression model. (M) Raster plot showing threshold crossing for inactive neurons, with some post-ICMS rebound. Each row represents an individual “inactive” neuron. The data are divided further by applied ICMS pattern (indicated by the color) and within pattern by animal (indicated by the dashed horizontal lines). “Inactive neurons” are neurons with fluorescent intensity less than 3 standard deviations above the baseline during ICMS. Inactive neurons never crossed threshold during ICMS, but did sometimes before and after ICMS as shown in the figure. (N and O) Post-stimulus time histograms for inactive neurons (N) and non-consecutive active neurons (O). Bars represent summed threshold crossings of all neurons across ICMS patterns. Colored plots represent threshold crossings for individual patterns smoothed with a 1 s Gaussian filter. Also see Figures S3 and S4 for additional response classes.
Figure 5
Figure 5
Inhibitory neurons are relatively more active and more likely to have increasing fluorescent intensity farther from the electrode (A) Violin plots show no significant difference in average distance from the electrode between active excitatory and inhibitory neurons. (B) Distribution of excitatory and inhibitory neurons across 25 μm bins away from the electrode. Active excitatory neurons peak around 100–125 μm while active inhibitory neurons peak around 175–200 μm. (C) The percent of excitatory and inhibitory neurons in 0–125, 125–200, and 200+ distance bins. (D and E) Violin plots of the mean intensity of excitatory (D) and inhibitory (E) neurons. Intensity decreases for both excitatory and inhibitory neurons farther from the electrode. (F and G) Violin plots of the average distance for ICMS-evoked classes for excitatory (F) and inhibitory neurons (G). RD neurons are farther and Stable/Increasing neurons are closer to the electrode. (H) Violin plot for distance of inactive excitatory neurons with rebound. The horizontal line marks the average active neuron distance from the electrode (234 μm). All violin plots are above the average, indicating inactive-rebound neurons are farther from the electrode than the average neuron. (I) The few “increasing” neurons found farther from the electrode were more likely to be inhibitory. (J) Both excitatory and inhibitory neurons farther from the electrode are more likely to be RD. (K) Pie plots showing neurons closer to the electrode (top row) prefer 10-Hz burst and neurons farther from the electrode (bottom row) prefer TBS. (L) Line plot showing average time-to-peak after burst onset for excitatory and inhibitory neurons in 25 μm bins. Inhibitory neurons have faster times-to-peak <225 μm from the electrode, but slower times to peak >225 μm. The vertical line marks the flip at 225 μm. Error bars indicate standard error across neurons within each bin. (M) Average traces of last six bursts for excitatory and inhibitory neurons that are <225 μm (top) or >225 μm (bottom). (N) Bar plots showing the average time-to-peak after burst onset for exc vs. inh neurons that are <225 μm (top) or >225 μm (bottom). Error bars indicate standard error across neurons within each bin. Statistical significance was determined using ANOVA. Significance levels are indicated as follows: p < 0.05 = ∗, p < 0.01 = ∗∗, p < 0.001 = ∗∗∗. Also see Figure S5.
Figure 6
Figure 6
Neurons closer to the electrode had stronger neuron-neuron and neuron-neuropil correlations during ICMS but weaker correlated activity during baseline compared to neurons farther from the electrode (A) Example image showing four individual neurons of different distances correlated in activity to a single neuron. Note that neurons farther from the single neuron have lower correlations. Scale bar represents 100 μm. (B–D) Average correlation value of neurons within different distance bins from the electrode for (B) excitatory-excitatory, (C) excitatory-inhibitory, and (D) inhibitory-inhibitory correlations. Neurons closer together tend to have higher correlations. ICMS-evoked responses have higher correlations than baseline responses. Error bars indicate the standard error across all calculated correlations. BL represents correlation to baseline activity (15 s pre-ICMS) while WN represents correlation to white noise processed with the same filter. (E) Example image with four neurons and the area of neuropil surrounding each neuron. (F) Traces for selected neuron responses to ICMS and the corresponding activation of the surrounding neuropil. (G) Bar plot showing the neuron-neuropil correlation for excitatory and inhibitory subpopulations for each ICMS pattern. Error bars indicate standard error across neurons. (H) Scatterplots with linear fits showing individual ICMS-evoked neuron-neuropil correlations as a function of distance. Correlations decreased farther from the electrode. (I) Scatterplots with linear fits showing individual baseline neuron-neuropil correlations as a function of distance. Correlations increased farther from the electrode. Statistical significance was determined using ANOVA. Significance levels are indicated as follows: p < 0.05 = ∗, p < 0.01 = ∗∗, p < 0.001 = ∗∗∗. Also see Figure S6.
Figure 7
Figure 7
Explanatory framework (A) The electrode disrupts nearby neuron connections, reducing baseline correlation; farther neurons maintain higher correlations that drop-off with distance. (B) Direct recruitment near the electrode, especially of excitatory neurons due to morphology, results in high correlations during ICMS. Indirect recruitment results in lower correlations that drop-off with distance due variance in synaptic integration. (C) Neurons near the electrode are primarily recruited directly at the axon/axon hillock. Direct activation bypasses normal synaptic processes by recruiting the axon, decreasing inhibitory influence. (D) Neurons farther from the electrode are primarily recruited indirectly via synaptic integration in the soma. Some neurons recruited indirectly are inhibited, which results in a decrease in activity during ICMS often followed by post-ICMS rebound. (E–H) Purported activation profiles of excitatory and inhibitory neurons during different ICMS profiles. The “Exc” and “Inh” traces illustrate the suggested population neural activation profiles, while the dotted lines represent the recorded calcium fluorescence profiles. (E) 100-Hz/high-frequency patterns induce rapid decreases in recruited neurons. Neurons near the electrode to have stable recruitment after initial decreases due to bypassing of synaptic integration (left). Farther neurons undergo continual decreases due to inhibitory drive and exhaustion. (F) 10-Hz uniform patterns weakly recruit neurons with single pulses and the space between pulses allows for recovery from inhibition. (G) 10-Hz burst patterns strongly activate excitatory and inhibitory neurons near the electrode, with inter-burst intervals allowing sufficient time for recovery. (H) TBS drives strong activation of neurons farther from the electrode (right) over time, with rhythmic oscillations produced by TBS “increasing” neurons (esp. inhibitory).

Similar articles

References

    1. Flesher S.N., Collinger J.L., Foldes S.T., Weiss J.M., Downey J.E., Tyler-Kabara E.C., Bensmaia S.J., Schwartz A.B., Boninger M.L., Gaunt R.A. Intracortical microstimulation of human somatosensory cortex. Sci. Transl. Med. 2016;8:361ra141. - PubMed
    1. Hughes C.L., Flesher S.N., Weiss J.M., Boninger M., Collinger J.L., Gaunt R.A. Perception of microstimulation frequency in human somatosensory cortex. eLife. 2021;10 - PMC - PubMed
    1. Armenta Salas M., Bashford L., Kellis S., Jafari M., Jo H., Kramer D., Shanfield K., Pejsa K., Lee B., Liu C.Y., Andersen R.A. Proprioceptive and cutaneous sensations in humans elicited by intracortical microstimulation. eLife. 2018;7 - PMC - PubMed
    1. Fifer M.S., McMullen D.P., Osborn L.E., Thomas T.M., Christie B., Nickl R.W., Candrea D.N., Pohlmeyer E.A., Thompson M.C., Anaya M.A., et al. Intracortical Somatosensory Stimulation to Elicit Fingertip Sensations in an Individual with Spinal Cord Injury. Neurology. 2022;98:E679–E687. - PMC - PubMed
    1. Fernandez E., Alfaro A., Soto-Sánchez C., Gonzalez-Lopez P., Lozano A.M., Peña S., Grima M.D., Rodil A., Gómez B., Chen X., et al. Visual percepts evoked with an intracortical 96-channel microelectrode array inserted in human occipital cortex. J. Clin. Investig. 2021;131:e151331. - PMC - PubMed

LinkOut - more resources