. 2025 May 23:10:275.
doi: 10.12688/wellcomeopenres.24154.1. eCollection 2025.

The chromosomal genome sequence of the sponge Crambe crambe (Schmidt, 1862) and its associated microbial metagenome sequences

Affiliations

The chromosomal genome sequence of the sponge Crambe crambe (Schmidt, 1862) and its associated microbial metagenome sequences

Manuel Maldonado et al. Wellcome Open Res. .

Abstract

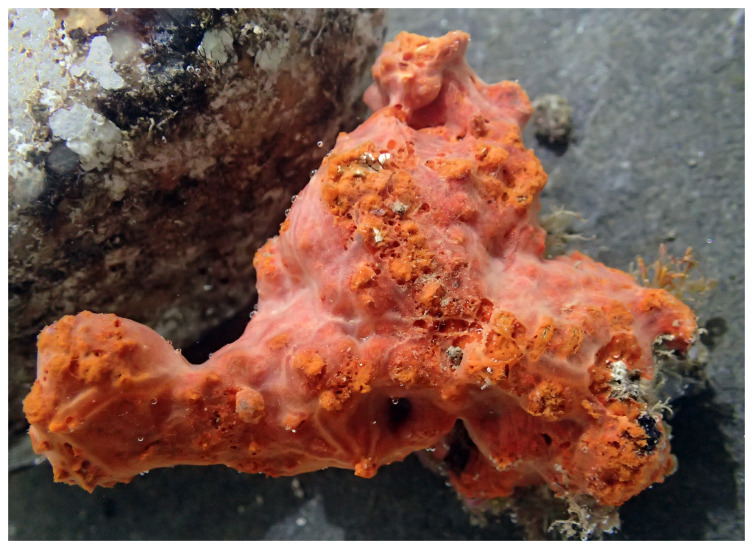
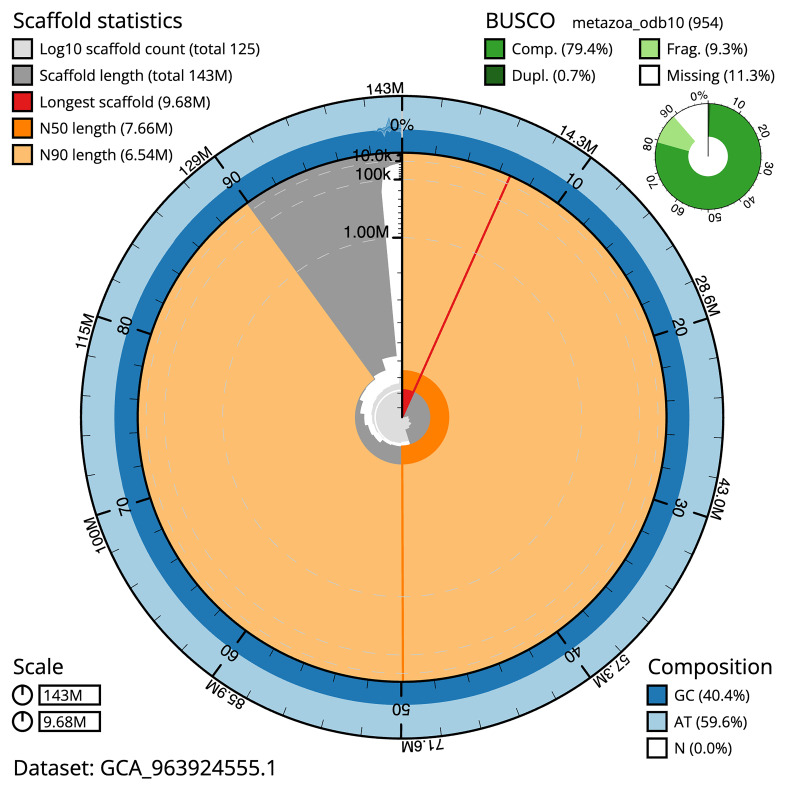
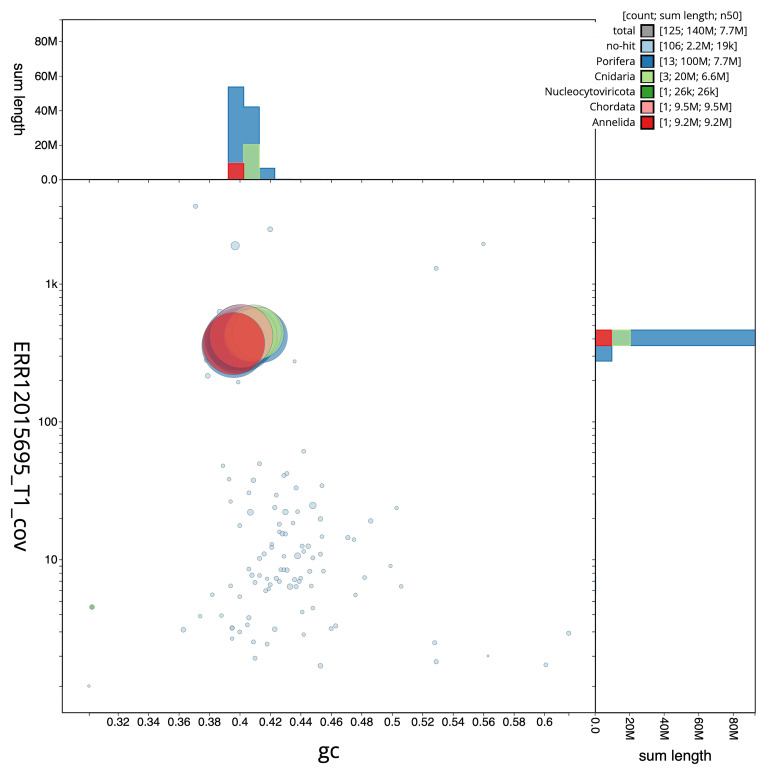
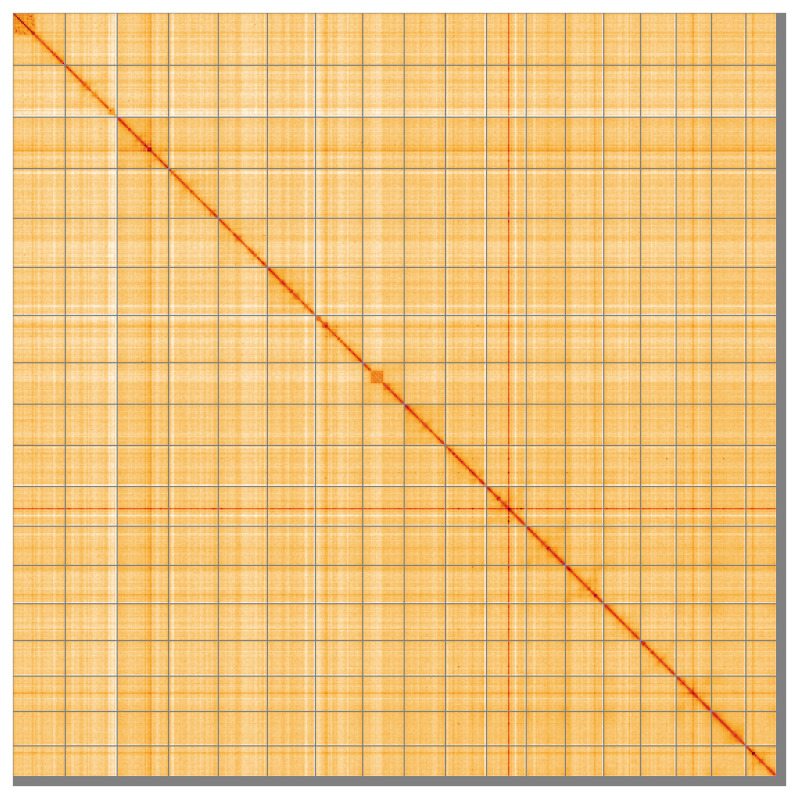
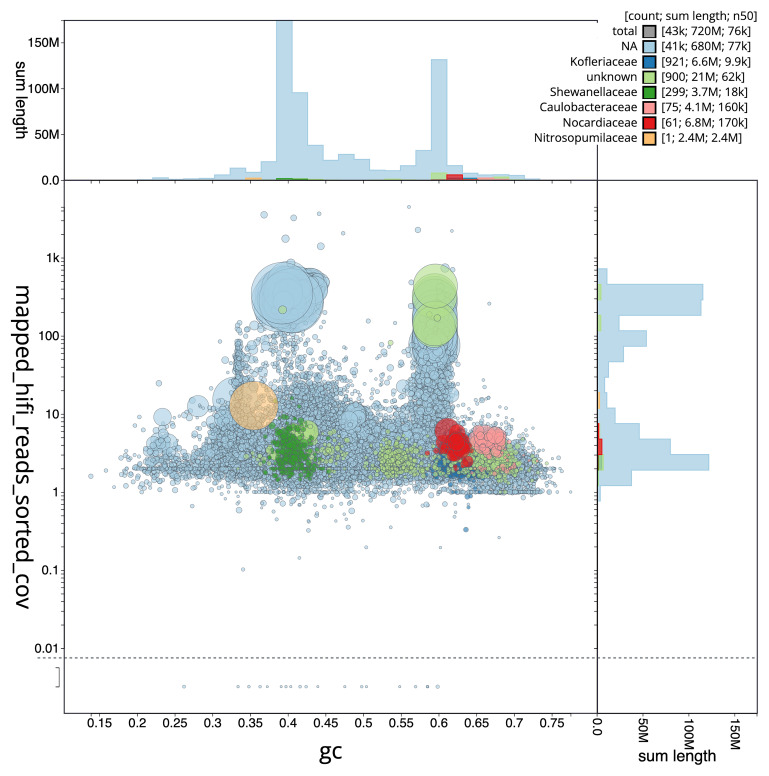
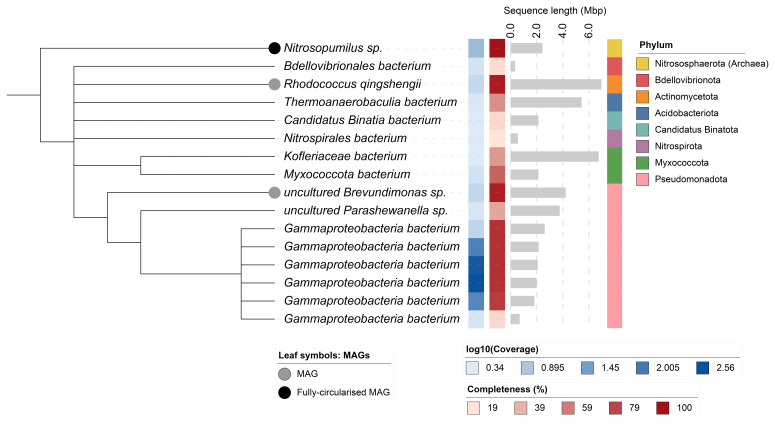
We present a genome assembly from an individual Crambe crambe (Porifera; Demospongiae; Poecilosclerida; Crambeidae). The host genome sequence is 143.20 megabases in span. Most of the assembly is scaffolded into 18 chromosomal pseudomolecules. The mitochondrial genome has also been assembled and is 19.53 kilobases in length. Several symbiotic prokaryotic genomes were assembled as MAGs, including two relevant sponge symbionts, the Candidatus Beroebacter blanensis/ AqS2 clade (Tethybacterales, Gammaproteobacteria) of LMA sponges, and the widely distributed archaeal Nitrosopumilus sp. clade.

Keywords: Crambe crambe; Poecilosclerida; chromosomal; genome sequence; marine sponge.


Conflict of interest statement

No competing interests were disclosed.

Figures

Figure 1.
Figure 1.. Photograph of the Crambe crambe (odCraCram1) specimen used for genome sequencing.
Figure 2.
Figure 2.. Genome assembly of Crambe crambe, odCraCram1.1: metrics.
The BlobToolKit Snailplot shows N50 metrics and BUSCO gene completeness. The main plot is divided into 1,000 size-ordered bins around the circumference with each bin representing 0.1% of the 143,197,480 bp assembly. The distribution of scaffold lengths is shown in dark grey with the plot radius scaled to the longest scaffold present in the assembly (9,683,886 bp, shown in red). Orange and pale-orange arcs show the N50 and N90 scaffold lengths (7,656,483 and 6,535,638 bp), respectively. The pale grey spiral shows the cumulative scaffold count on a log scale with white scale lines showing successive orders of magnitude. The blue and pale-blue area around the outside of the plot shows the distribution of GC, AT and N percentages in the same bins as the inner plot. A summary of complete, fragmented, duplicated and missing BUSCO genes in the metazoa_odb10 set is shown in the top right. An interactive version of this figure is available at https://blobtoolkit.genomehubs.org/view/Crambe_crambe/dataset/GCA_963924555.1/snail.
Figure 3.
Figure 3.. Genome assembly of Crambe crambe, odCraCram1.1: BlobToolKit GC-coverage plot.
Scaffolds are coloured by phylum. Circles are sized in proportion to scaffold length. Histograms show the distribution of scaffold length sum along each axis. An interactive version of this figure is available at https://blobtoolkit.genomehubs.org/view/Crambe_crambe/dataset/GCA_963924555.1/blob.
Figure 4.
Figure 4.. Genome assembly of Crambe crambe, odCraCram1.1: BlobToolKit cumulative sequence plot.
The grey line shows cumulative length for all scaffolds. Coloured lines show cumulative lengths of scaffolds assigned to each phylum using the buscogenes taxrule. An interactive version of this figure is available at https://blobtoolkit.genomehubs.org/view/Crambe_crambe/dataset/GCA_963924555.1/cumulative.
Figure 5.
Figure 5.. Genome assembly of Crambe crambe, odCraCram1.1: Hi-C contact map of the odCraCram1.1 assembly, visualised using HiGlass.
Chromosomes are shown in order of size from left to right and top to bottom. An interactive version of this figure may be viewed at https://genome-note-higlass.tol.sanger.ac.uk/l/?d=IeGb4iyXTOqWeiUVkpdMrA.
Figure 6.
Figure 6.. Blob plot of base coverage in mapped against GC proportion for sequences in the metagenome of Crambe crambe.
Binned metagenomes are coloured by family. Circles are sized in proportion to sequence length on a square root scale, ranging from 501 to 4,126,685. Histograms show the distribution of sequence length sum along each axis An interactive version of this figure may be viewed here.
Figure 7.
Figure 7.. Cladogram showing the taxonomic placement of metagenome bins, constructed using NCBI taxonomic identifiers with taxonomizr and annotated in iTOL.
Colours indicate phylum-level taxonomy. Additional tracks show sequencing coverage (log₁₀), estimated genome size (Mbp), and completeness. Bins that meet the criteria for MAGs are marked with a grey circle; the single fully circularised MAG is marked in black.

Similar articles

References

    1. Abdennur N, Mirny LA: Cooler: scalable storage for Hi-C data and other genomically labeled arrays. Bioinformatics. 2020;36(1):311–316. 10.1093/bioinformatics/btz540 - DOI - PMC - PubMed
    1. Allio R, Schomaker-Bastos A, Romiguier J, et al. : MitoFinder: efficient automated large-scale extraction of mitogenomic data in target enrichment phylogenomics. Mol Ecol Resour. 2020;20(4):892–905. 10.1111/1755-0998.13160 - DOI - PMC - PubMed
    1. Altschul SF, Gish W, Miller W, et al. : Basic Local Alignment Search Tool. J Mol Biol. 1990;215(3):403–410. 10.1016/S0022-2836(05)80360-2 - DOI - PubMed
    1. Bateman A, Martin MJ, Orchard S, et al. : UniProt: the universal protein knowledgebase in 2023. Nucleic Acids Res. 2023;51(D1):D523–D531. 10.1093/nar/gkac1052 - DOI - PMC - PubMed
    1. Becerro MA, Uriz MJ, Turón X: Trends in space occupation by the encrusting sponge Crambe crambe: variation in shape as a function of size and environment. Mar Biol. 1994;121:301–307. 10.1007/BF00346738 - DOI

LinkOut - more resources