. 2025 May 30:16:1612916.
doi: 10.3389/fphar.2025.1612916. eCollection 2025.

HGF/c-MET axis contributes to CLL cell survival by regulating multiple mechanisms making it a potential therapeutic target for CLL treatment

Affiliations

HGF/c-MET axis contributes to CLL cell survival by regulating multiple mechanisms making it a potential therapeutic target for CLL treatment

Shihao Liang et al. Front Pharmacol. .

Abstract

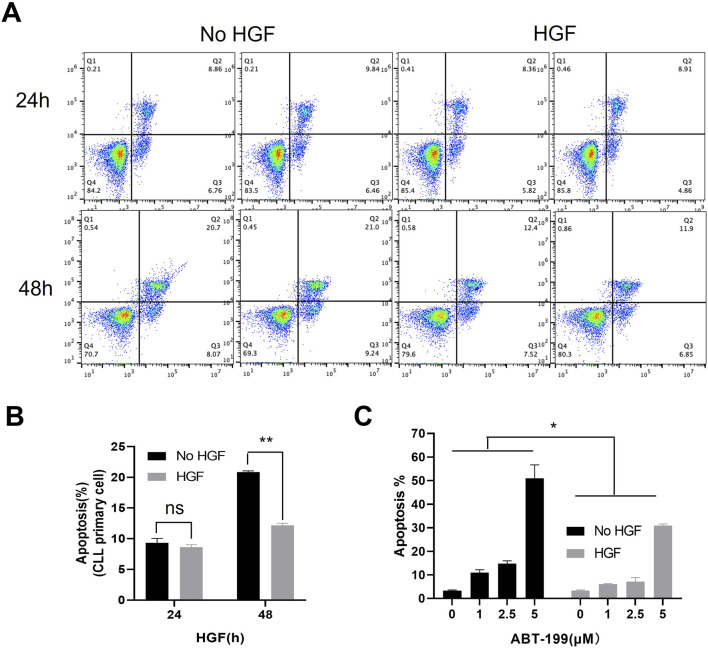
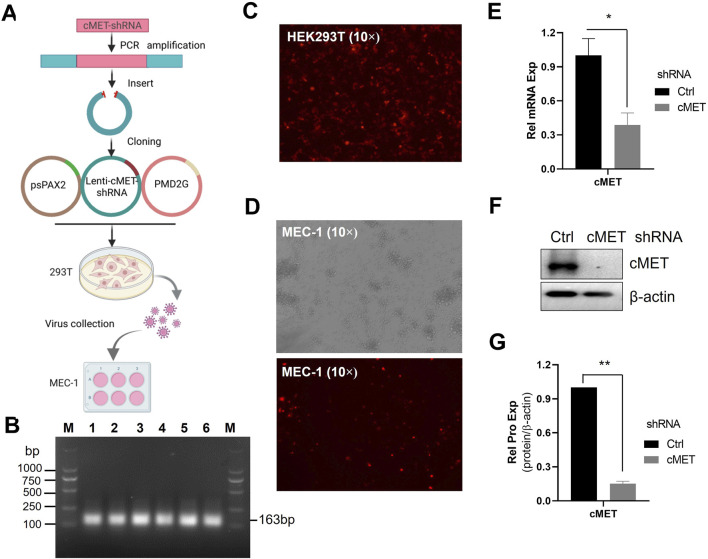
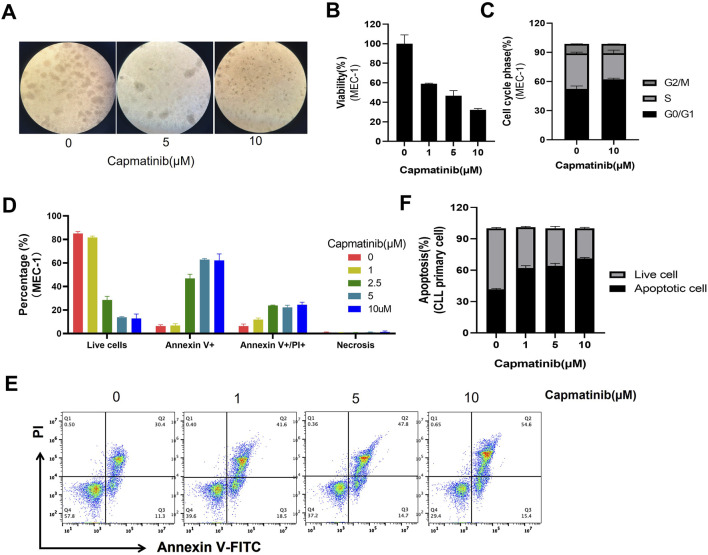
Despite significant advances in understanding the occurrence, progression and treatment of chronic lymphocytic leukemia (CLL), there remains a need to explore novel mechanisms and therapeutic strategies. In this study, we discovered that hepatocyte growth factor (HGF), a cytokine highly expressed by bone marrow mesenchymal stem cells within the microenvironment, activates the AKT, ERK and STAT3 signaling pathways, promotes the expression of anti-apoptotic proteins BCL-2, MCL-1, and BCL-xL, thereby enhancing CLL cell survival and resistance to both natural and ABT-199-induced apoptosis. Knockdown of c-MET, the unique receptor for HGF, using lentivirus-mediated shRNA, significantly attenuated the activation of these pro-survival signaling pathways and downregulated the expression of anti-apoptotic proteins in the BCL-2 family. Consequently, this inhibited CLL cell proliferation and promoted apoptosis. Similarly, pharmacological targeting of the HGF/c-MET pathway with the inhibitor capmatinib markedly suppressed the activation of pro-survival signaling pathways, reduced the expression of anti-apoptotic proteins, inhibited cell proliferation, arrested cell cycle at G0/G1 stage, induced apoptosis, and enhanced the pro-apoptotic effect of ABT-199. In summary, this study highlights the critical role of HGF/c-MET axis in CLL cell survival and demonstrates that targeting this pathway holds therapeutic potential for the treatment of CLL.

Keywords: HGF/c-Met; anti-apoptotic proteins; capmatinib; chronic lymphocytic leukemia; signaling pathway.


Conflict of interest statement

The authors declare that the research was conducted in the absence of any commercial or financial relationships that could be construed as a potential conflict of interest.

Figures

FIGURE 1
FIGURE 1
HGF enhances CLL cells survival and resistance to ABT-199. (A) Flow cytometry scatter plot for primary CLL cells treated with 100 ng/ml HGF, cell death was assessed by FACS after 24 or 48 h of treatments. (B) The percentage of apoptotic cells from (A) is shown. (C) MEC-1 cells were treated with different concentrations of ABT-199 for 48 h, and the percentage of apoptotic cells was analyzed by FACS. Statistical analysis was performed using GraphPad Prism 8.0 software and t-test. *p < 0.05, **p < 0.01, ***p < 0.001 indicate statistically significant differences between the HGF-treated group and the control group (untreated group). Non-significant results are denoted as “ns”.
FIGURE 2
FIGURE 2
HGF activates multiple signaling pathways and upregulates anti-apoptotic proteins. (A) MEC-1 cells were treated with 100 ng/ml HGF and collected at different time points, WB was performed to assess the protein expression levels of AKT, p-AKT, ERK, p-ERK, STAT3, and p-STAT3. (C) The mRNA transcription levels and (D) protein expression of BCL-2 family anti-apoptotic proteins were analyzed using qPCR and WB, respectively. Relative gene expression was calculated based on threshold cycle (Ct) values and normalized to the internal control β-actin using the 2ΔΔ Ct method. All the experiment were conducted in triplicate and repeated at least three times. β-actin served as the internal reference protein. (B, E) Quantitative analysis of the protein bands in (A, D) was performed using ImageJ software. The intensity of each protein bands was normalized to β-actin, and the data shown are representative images from three independent experiments.
FIGURE 3
FIGURE 3
The construction of c-MET-shRNA plasmids. (A) Schematic flowchart of acquisition of c-MET-shRNA lentiviral particles. (B) PCR amplification of the c-MET-shRNA fragment. (C) Immunofluorescence microscopy analysis of transfection efficiency in HEK293T cells transfected with c-MET-shRNA vector plasmid and packaging plasmids. (D) Immunofluorescence microscopy analysis of c-MET-shRNA expression in MEC-1 cells following doxycycline induction. (E) RT-qPCR analysis of c-MET mRNA expression levels in MEC-1 cells infected with c-MET-shRNA lentivirus. (F) WB analysis of c-MET protein expression. (G) Quantitative analysis of the protein bands in (F) using ImageJ software. Band intensities were normalized to internal control β-actin.
FIGURE 4
FIGURE 4
Knockdown of c-MET inhibits pro-survival signal and induces cell apoptosis. (A) WB detection of the expression of AKT, p-AKT, ERK, p-ERK, STAT3, p-STAT3 signaling proteins in MEC-1 cells. (C) WB analysis of the expression of anti-apoptotic proteins BCL-2, BCL-xL, and MCL-1 expression. β-actin was used as the internal reference protein. The data shown are representative images from two independent experiments. (B, D) Quantitative analysis of the protein bands in (A, C) using ImageJ software. Band intensities were normalized to internal control β-actin. (E) Cell proliferation was assessed using the MTS assay, with two sample replicates and three experimental replicates. (F) Flow cytometry scatter plots of cells treated with c-MET-shRNA. (G) The percentage of live cells and apoptotic cells relative to the total cell population. Statistical significance was determined using GraphPad Prism 8.0 software and the t-test, *p < 0.05, **p < 0.01, ***p < 0.001 indicate statistically significant differences between the c-MET-shRNA treated group and the untreated group. Non-significant results are denoted as “ns”.
FIGURE 5
FIGURE 5
Capmatinib inhibits cell proliferation and induces apoptosis. (A) MEC-1 cells were treated with different concentrations of capmatinib for 48 h, and the cell viability was observed using microscopy. (B) Cell viability was measured using MTS assay. (C) The percentage of cells in different cell cycle stages. Date are representatives of three independent experiments, with results expressed as mean ± standard deviation. (D) The graph shows the percentage of live and apoptotic MEC-1 cells treated with different concentrations of capmatinib for 72 h. Experiments were performed in triplicate and repeated at least three times. (E) Flow cytometry scatter plots showing apoptosis in primary CLL cells treated with capmatinib at different doses. (F) The percentage of live cells and apoptotic cells in (E) is shown.
FIGURE 6
FIGURE 6
The effects of blocking the HGF/c-MET axis cell pro-survival signals in CLL cells. (A) WB analysis of the activation status of AKT, ERK, andSTAT3 signaling proteins in MEC-1 cells. (C) WB analysis of the same proteins in primary CLL cells. (E) WB detection of the expression levels of anti-apoptotic proteins BCL-2, BCL-xL, and MCL-1 in MEC-1 cells. (G) WB detection of the same anti-apoptotic proteins in primary CLL patient cells. β-actin was used as an internal reference protein for normalization. The data shown are representative images from two independent experiments. (B, D, F, H) Quantitative analysis of the protein bands in (A, C, E, G) was performed using ImageJ software. Band intensities were normalized to internal control β-actin.
FIGURE 7
FIGURE 7
The synergistic effect of capmatinib and ABT-199 on inducing apoptosis in CLL cells. Flow cytometry scatter plots of (A) MEC-1 cells and (B) primary CLL cells treated with ABT-199 alone or combing with capmatinib. (C, D) The quantification analysis of apoptotic cells and live cells in (A, B). The graphs show representative of three independent experiments, with results expressed as mean ± standard deviation. (E) WB analysis of the protein expression of PARP and caspase-3 in MEC-1 cells and primary CLL cells. (F) Quantitative analysis of protein bands in (E). Statistical significance was determined using GraphPad Prism 8.0 software and the two-way ANOVA. *p < 0.05, **p < 0.01, ***p < 0.001 indicate that statistically significant differences between capmatinib-treated group and untreated group. Non-significant results are denoted as “ns”.
FIGURE 8
FIGURE 8
Targeting the HGF/c-MET axis suppresses pro-survival signaling and sensitizes CLL cells to ABT-199-induced apoptosis. The HGF/c-MET axis promotes CLL cells survival by activating AKT, ERK, and STAT3 pro-survival pathways and upregulating BCL-2 family anti-apoptotic proteins, which collectively confer resistance to ABT-199-induced apoptosis. Genetic silencing of c-MET or pharmacological blockade of HGF/c-MET signaling via capmatinib disrupts these survival mechanisms, suppresses proliferation, and restores sensitivity to ABT-199-induced cell death.

Similar articles

References

    1. Baljevic M., Zaman S., Baladandayuthapani V., Lin Y. H., de Partovi C. M., Berkova Z., et al. (2017). Phase II study of the c-MET inhibitor tivantinib (ARQ 197) in patients with relapsed or relapsed/refractory multiple myeloma. Ann. Hematol. 96 (6), 977–985. 10.1007/s00277-017-2980-3 - DOI - PMC - PubMed
    1. Birchmeier C., Birchmeier W., Gherardi E., Vande Woude G. F. (2003). Met, metastasis, motility and more. Nat. Rev. Mol. Cell Biol. 4 (12), 915–925. 10.1038/nrm1261 - DOI - PubMed
    1. Bladt F., Riethmacher D., Isenmann S., Aguzzi A., Birchmeier C. (1995). Essential role for the c-met receptor in the migration of myogenic precursor cells into the limb bud. Nature 376 (6543), 768–771. 10.1038/376768a0 - DOI - PubMed
    1. Brown J. R. (2016). The PI3K pathway: clinical inhibition in chronic lymphocytic leukemia. Seminars Oncol. 43 (2), 260–264. 10.1053/j.seminoncol.2016.02.004 - DOI - PubMed
    1. Bussolino F., Di Renzo M. F., Ziche M., Bocchietto E., Olivero M., Naldini L., et al. (1992). Hepatocyte growth factor is a potent angiogenic factor which stimulates endothelial cell motility and growth. J. Cell Biol. 119 (3), 629–641. 10.1083/jcb.119.3.629 - DOI - PMC - PubMed

LinkOut - more resources