

Machine learning and explainable artificial intelligence to predict and interpret lead toxicity in pregnant women and unborn baby
- PMID: 40520215
- PMCID: PMC12162601
- DOI: 10.3389/fdgth.2025.1608949
Machine learning and explainable artificial intelligence to predict and interpret lead toxicity in pregnant women and unborn baby
Abstract
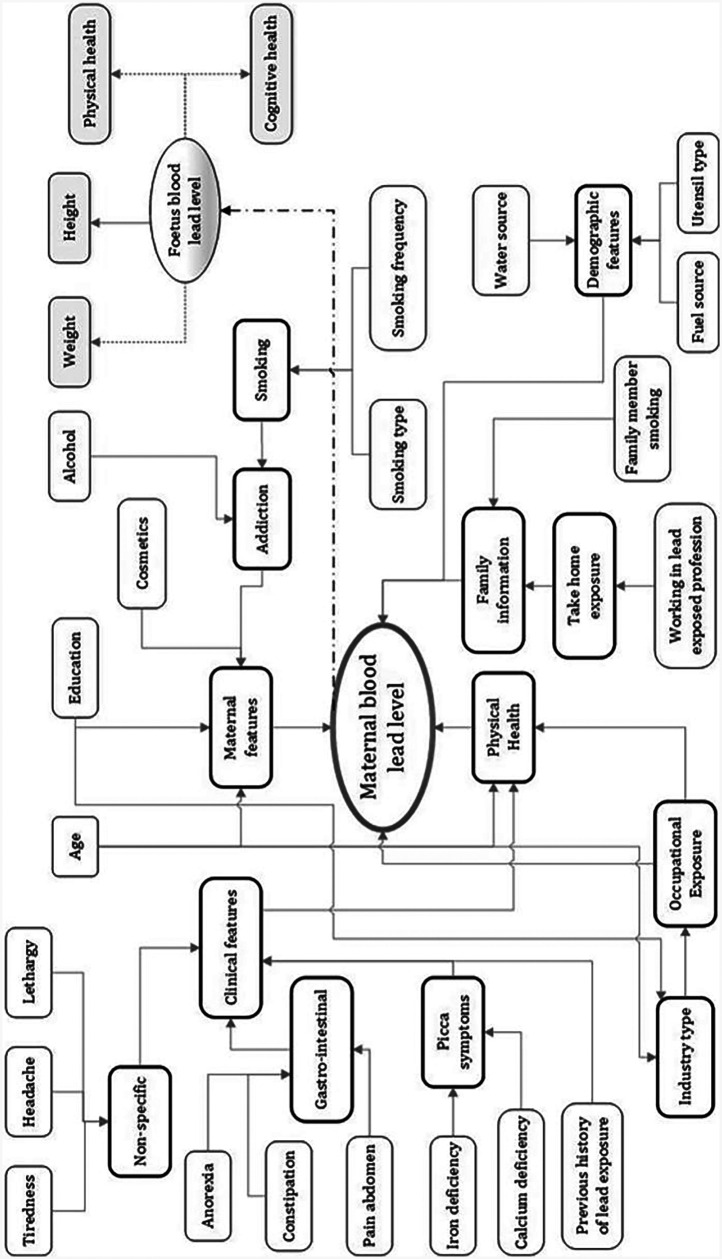
Introduction: Lead toxicity is a well-recognised environmental health issue, with prenatal exposure posing significant risks to infants. One major pathway of exposure to infants is maternal lead transfer during pregnancy. Therefore, accurately characterising maternal lead levels is critical for enabling targeted and personalised healthcare interventions. Current detection methods for lead poisoning are based on laboratory blood tests, which are not feasible for the screening of a wide population due to cost, accessibility, and logistical constraints. To address this limitation, our previous research proposed a novel machine learning (ML)-based model that predicts lead exposure levels in pregnant women using sociodemographic data alone. However, for such predictive models to gain broader acceptance, especially in clinical and public health settings, transparency and interpretability are essential.
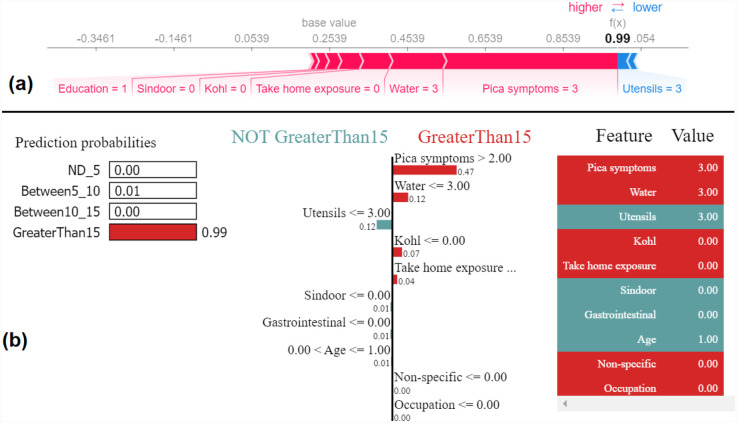
Methods: Understanding the reasoning behind the predictions of the model is crucial to building trust and facilitating informed decision-making. In this study, we present the first application of an explainable artificial intelligence (XAI) framework to interpret predictions made by our ML-based lead exposure model.
Results: Using a dataset of 200 blood samples and 12 sociodemographic features, a Random Forest classifier was trained, achieving an accuracy of 84.52%.
Discussion: We applied two widely used XAI methods, SHAP (SHapley additive explanations) and LIME (Local Interpretable Model-Agnostic Explanations), to provide insight into how each input feature contributed to the model's predictions.
Keywords: classification; explainable AI; lead toxicity; machine learning; predictive modelling.
© 2025 Chaurasia, Yogarajah, Ali Mahdi, McClean, Kaleem Ahmad, Jafar and Kumar Singh.
Conflict of interest statement
The authors declare that the research was conducted in the absence of any commercial or financial relationships that could be construed as a potential conflict of interest.
Figures


Similar articles
-
Investigating Protective and Risk Factors and Predictive Insights for Aboriginal Perinatal Mental Health: Explainable Artificial Intelligence Approach.J Med Internet Res. 2025 Apr 30;27:e68030. doi: 10.2196/68030. J Med Internet Res. 2025. PMID: 40306634 Free PMC article.
-
Model-agnostic explainable artificial intelligence tools for severity prediction and symptom analysis on Indian COVID-19 data.Front Artif Intell. 2023 Dec 4;6:1272506. doi: 10.3389/frai.2023.1272506. eCollection 2023. Front Artif Intell. 2023. PMID: 38111787 Free PMC article.
-
Utilization of model-agnostic explainable artificial intelligence frameworks in oncology: a narrative review.Transl Cancer Res. 2022 Oct;11(10):3853-3868. doi: 10.21037/tcr-22-1626. Transl Cancer Res. 2022. PMID: 36388027 Free PMC article. Review.
-
Breast Lesion Detection Using Weakly Dependent Customized Features and Machine Learning Models with Explainable Artificial Intelligence.J Imaging. 2025 Apr 28;11(5):135. doi: 10.3390/jimaging11050135. J Imaging. 2025. PMID: 40422992 Free PMC article.
-
The role of explainable artificial intelligence in disease prediction: a systematic literature review and future research directions.BMC Med Inform Decis Mak. 2025 Mar 4;25(1):110. doi: 10.1186/s12911-025-02944-6. BMC Med Inform Decis Mak. 2025. PMID: 40038704 Free PMC article.
References
-
- Roberts DJ, Bradberry SM, Butcher F, Busby A. Lead exposure in children. BMJ. (2022) 377:e063950. 10.1136/bmj-2020-063950 - DOI
-
- WHO. Data from: Lead poisoning—who.int (2025). Available at: https://www.who.int/news-room/fact-sheets/detail/lead-poisoning-and-health (Accessed April 03, 2025).
LinkOut - more resources
Full Text Sources
Research Materials