. 2025;11(1):179.
doi: 10.1038/s41524-025-01670-x. Epub 2025 Jun 12.

High-throughput alloy and process design for metal additive manufacturing

Affiliations

High-throughput alloy and process design for metal additive manufacturing

Sofia Sheikh et al. NPJ Comput Mater. 2025.

Abstract

Many engineering alloys originally designed for conventional manufacturing lack considerations for additive manufacturing (AM), presenting opportunities for novel alloy designs. Evaluating alloy printability requires extensive analysis of chemical composition and processing conditions. The complexity of experimental exploration drives the need for high-throughput computational frameworks. This study introduces a framework that integrates material properties, processing parameters, and melt pool profiles from three thermal models to assess process-induced defects, such as lack-of-fusion, balling, and keyholing. A deep learning surrogate model accelerates the printability assessment by 1000 times without losing accuracy. We validate the framework with printability maps for the equiatomic CoCrFeMnNi system and apply it to explore printable alloys in the Co-Cr-Fe-Mn-Ni high-entropy alloy space. Ensemble probabilistic printability maps further provide insights into defect likelihood and uncertainty, enhancing alloy design for AM by efficiently navigating vast design spaces.

Keywords: Engineering; Metals and alloys.


Conflict of interest statement

Competing interestsThe authors declare no competing interests.

Figures

Fig. 1
Fig. 1. An Example Printability Map.
This figure presents a general printability map for L-PBF metal AM processing conditions, highlighting macroscopic defects: lack-of-fusion (salmon), keyholing (blue), and balling (teal). The white area represents the predicted defect-free P-V space. Defect boundaries are based on specific criteria: the dashed black line indicates the maximum hatch spacing (Equation (13)) for adequate track overlap, and the red dashed line marks the keyholing boundary. Salmon: Lack-of-fusion predicted region. Blue: Keyholing predicted region. Teal: Balling predicted region. LOF lack-of-fusion, KH keyholing; Ball, balling.
Fig. 2
Fig. 2. Overview of the Challenges and Framework for Alloy Design in L-PBF.
Overview of challenges and research gaps in alloy design for L-PBF, alongside the proposed method. Current Methods: a Printability maps constructed using analytical, FEM, and ML approaches are computationally expensive due to the need for experimental validation. b Trial-and-error and DOE methods explore the alloy and composition space in L-PBF, resulting in significant costs in both time and expenses. Research Gaps: c Designing alloys that optimize both performance and composition. d Overcoming limitations of traditional methods and avoiding narrow alloy space exploration. e Mitigating bottlenecks in HTP exploration caused by limited tools and resources for alloy design in L-PBF. Proposed Framework: f Calculate material properties using CALPHAD methods and accelerate melt pool predictions through a surrogate model for the analytical thermal model. g Determine defect boundaries based on various criteria. h Use these boundaries to create printability maps. i Assess the printability of selected alloys and rank them based on property and printability criteria to achieve specific performance goals. FEM: finite element method. DOE: design of experiments. P [W]: laser power in watts. v [mm/s]: scan speed. W: melt pool width. D: melt pool depth.
Fig. 3
Fig. 3. Count of Literature Studies on High Entropy Alloys.
Studies on various HEAs in the literature show that HEAs containing Co, Cr, Fe, Mn, and Ni are among the most widely researched alloys. Therefore, we can narrow our composition space to include only HEAs with the specified elements.
Fig. 4
Fig. 4. Parameter spaces explored in literature for cantor alloy.
The histogram and kernel density estimate (KDE) plots for a volume energy density (VED), b power, and c velocity show the distribution of values used to print for the equiatomic CoCrFeMnNi alloy, as documented in the literature. The density represents the probability density function of the parameter on the x-axis in the plot.
Fig. 5
Fig. 5. Printability Maps with Highest Accuracy for the Cantor Alloy System Using Each Thermal Model.
a Using the LOF2, KH2, and Ball1 criteria set and the analytical E-T thermal model, the predicted printability map exhibited an accuracy of 76%. The corresponding printable index is 17.1%. b Using the NN (ML) E-T model to calculate the melt pool geometry, the accuracy was again 76% while the printability index was calculated to be 18.5%. c The dimensionless E-T model achieved a maximum accuracy of 72%, with a higher printable index of 22.2%. LOF: lack-of-fusion. KH: Keyholing. Ball: Balling. Red dotted line: Keyholing boundary line. Dashed black line: Maximum hatch spacing needed to fabricate a fully dense part. Circle: Experimentally observed defect-free single track. Square: Ex-obs lack-of-fusion defect. Triangle: Experimentally observed balling defect. Diamond: Experimentally observed keyholing defect. Salmon-shaded region: Predicted lack-of-fusion region. Blue-shaded region: Predicted keyholing region. Teal-shaded region: Predicted balling region.
Fig. 6
Fig. 6. Probability Printability Maps for Cantor Alloys.
Each of the 12 printability maps illustrates the distinction based on the thermal model type implemented. a The probability printability map uses the analytical E-T model melt pool dimensions, which Analytical Eagar-Tsai Thermal Model describes, b The probability printability map utilizes the NN E-T model melt pool dimensions, which Machine Learning Model for Eagar-Tsai Thermal Model describes, c The probability printability map uses the dimensionless form of the E-T model melt pool dimensions, which Eagar-Tsai Thermal Model in Dimensionless Form describes. These maps address the three decision problems for each defect criterion related to defect presence (i.e., lack-of-fusion, keyholing, and balling). The transparency of the region determines the likelihood of a defect occurring within the power-velocity space.
Fig. 7
Fig. 7. The Tri-Objective Pareto Front of the Co-Cr-Fe-Mn-Ni Alloy Space.
a The figure plots the tri-objective Pareto front in the objective space, representing the FCC constraint as a color axis. b The figure maps the Pareto-front onto the ΔTSolid-CSC axis with τsolid/τspread as the color axis. c The Pareto-front projected onto the τsolid/τspread-CSC plane with ΔTSolid as the color axis. d The figure projects the Pareto-front on the ΔTSolid-τsolid/τspread axis with CSC as the color axis. CSC hot cracking susceptibility coefficient. τsolid: characteristic solidification time. τspread: characteristic spreading time. ΔTsolid: solidification range. Star: Composition points that fulfill the tri-objective criteria.
Fig. 8
Fig. 8. Tri-Objective Pareto Front in the Composition Space for the Co-Cr-Fe-Mn-Ni Alloy Space.
The tri-objective Pareto front plots in the composition space. Grey represents the alloys that fail the FCC constraint. The t-SNE projections of the CoCrFeMnNi alloy space display a the ratio of characteristic solidification time to characteristic spreading time, b the soldification range and c the cracking coefficient, highlighting how the printability objectives vary with composition. CSC hot cracking susceptibility coefficient. τsolid: characteristic solidification time. τspread: characteristic spreading time. ΔTsolid: solidification range. Star: Composition points that fulfill the tri-objective criteria.
Fig. 9
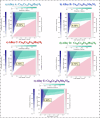
Fig. 9. Ensemble probability printability maps for pareto front alloys using NN E-T Model.
Using the NN (ML) E-T model to calculate the melt pool profile for the five sampled alloys. The printability map for a Alloy A, b Alloy B, c Alloy C, d Alloy D and e Alloy E are displayed. Alloy E (Co20Cr40Mn5Fe5Ni30) achieved the highest printability index of 5.89%. Alloy A (Co15Cr15Mn5Fe60Ni5) has the lowest printability index at 4.22%. Both printability index values exceed the printability index of 3.52%, calculated from the printability maps generated using the NN (ML) E-T model for the equiatomic CoCrFeMnNi. Salmon-shaded region: Area that represents the predicted lack-of-fusion region. Blue-shaded region: Area that represents the predicted keyholing region. Teal-shaded region: Area that represents the predicted balling region. Red dashed line: Keyholing boundary. Black dashed lines: Maximum hatch spacing required for sufficient overlap in a fully built part.
Fig. 10
Fig. 10. Ranking optimized alloys for high-temperature application with NN E-T model.
The radar chart summarizes the results for the alloys predicted using the Pareto front objectives and further analyzes the performance and printability of the alloys based on the four objectives: hot cracking susceptibility, solidification range, composition-based balling, and the printability index when using the neural network E-T model. The chart inverts the axis for hot cracking susceptibility and solidification range to maximize all objectives.
Fig. 11
Fig. 11. Printability Index comparison between a low entropy alloy and a high entropy alloy.
a A t-SNE projection visualizes design space, with the printability index plotted over this space. Comparing b high entropy alloy and c low entropy alloy printability maps reveals that the low entropy alloy achieves a higher printability index because defects such as balling and keyholing are less prominent compared to the high entropy alloy. The low entropy alloy achieves a printability index of 21.5%. On the other hand, the high entropy alloy achieves a printability index of 9.2%. Print. Index Printability Index, W melt pool width, h hatch spacing, t powder layer thickness, D melt pool width. ΔH: specific enthalpy. Tboiling: boiling temperature. Tmelting: melting temperature. hs: specific enthalpy at melting. Salmon-shaded region: Area that represents the predicted lack-of-fusion region. Blue-shaded region: area that represents the predicted keyholing region. Teal-shaded region: area that represents the predicted balling region. Red dashed line: keyholing boundary. Black dashed lines: Maximum hatch spacing required for sufficient overlap in a fully built part.
Fig. 12
Fig. 12. NN Surrogate E-T Model Prediction Performance.
The analysis compares the NN surrogate model predictions to the analytical E-T model predictions. The performance metrics R2, mean absolute error (MAE), and root mean squared error (RMSE) show that the NN model accurately predicts the melt pool dimensions for a melt pool length, b melt pool width, c melt pool depth, and d maximum temperature (Tmax) of the melt pool at a faster computational time. K: Kelvin. m: meters.

References

    1. Gardan, J. Additive manufacturing technologies: state of the art and trends. Additive Manufacturing Handbook 149–168 (2017).
    1. Vafadar, A., Guzzomi, F., Rassau, A. & Hayward, K. Advances in metal additive manufacturing: a review of common processes, industrial applications, and current challenges. Appl. Sci.11, 1213 (2021).
    1. Liu, S. & Shin, Y. C. Additive manufacturing of Ti6Al4V alloy: A review. Mater. Des.164, 107552 (2019).
    1. Kotadia, H., Gibbons, G., Das, A. & Howes, P. A review of laser powder bed fusion additive manufacturing of aluminium alloys: Microstructure and properties. Addit. Manuf.46, 102155 (2021).
    1. Adeyemi, A., Akinlabi, E. T. & Mahamood, R. M. Powder bed based laser additive manufacturing process of stainless steel: A review. Mater. Today.: Proc.5, 18510–18517 (2018).

LinkOut - more resources