. 2025 May 14;36(2):102561.
doi: 10.1016/j.omtn.2025.102561. eCollection 2025 Jun 10.

Durable HTT silencing using non-evolved dCas9 epigenome editors in patient-derived cells

Affiliations

Durable HTT silencing using non-evolved dCas9 epigenome editors in patient-derived cells

Jennifer J Waldo et al. Mol Ther Nucleic Acids. .

Abstract

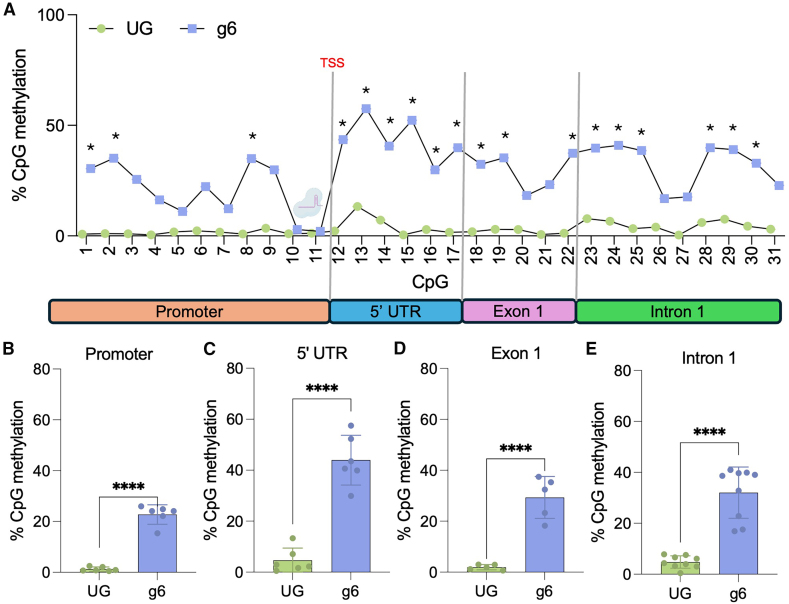
Huntington's disease (HD) is an autosomal dominant neurodegenerative disorder caused by a trinucleotide repeat expansion in exon 1 of the huntingtin (HTT) gene. Nuclease-deficient Cas9 protein (dCas9) epigenetic editing for targeted gene regulation is a promising therapeutic approach for HD through downregulation of the causative gene, HTT. A screen of several dCas9 variants with expanded PAM recognition was fused to KRAB and DNMT3A/L to assess the ability to downregulate total HTT. Surprisingly, only S pdCas9 could significantly downregulate HTT, while expanded PAM recognition variants dxCas9 and dCas9-VQR were less efficient or unable to reduce HTT expression. Using our lead construct with S pdCas9, DNA methylation changes were assessed through reduced representation bisulfite sequencing, showing high on-target increases in DNA methylation and few off-targets. In addition, HTT silencing was mitotically stable for up to 6 weeks in a rapidly dividing cell line. Finally, significant downregulation of HTT was achieved in patient-derived neuronal stem cells, showing the efficacy of this system in a disease-relevant cell type. This approach represents a novel therapeutic pathway for the treatment of HD.

Keywords: CRISPR; DNA methylation; Huntington’s disease; MT: RNA/DNA Editing; dCas9; epigenetics.


Conflict of interest statement

The authors declare no competing interests.

Figures

None
Graphical abstract
Figure 1
Figure 1
CRISPRoff can downregulate HTT in 293s (A) HTT expression in 5 cell lines based on fragments per kilobase of transcript per million mapped reads (FPKM). ∗∗p < 0.01, ∗∗∗p < 0.001, and ∗∗∗∗p < 0.0001 using a one-way ANOVA. (B–D) Quartiles of FPKM of all genes in (B) HEK293, (C) K562, and (D) neural progenitors. Only values above 1 FPKM were included. The box represents 25%–75% of values within that quartile, the line within the box represents the median value, and vertical lines represent the minimum and maximum values in that group. (E) UCSC hg37 genome browser track showing HTT TSS, gRNA binding sites, CpG island, H3K27ac, and DNAse hypersensitivity regions. (F) HTT expression of 293AAV cells transfected with the SpdCas9 CRISPRoff system, taken down at 48 h post-transfection. ∗p < 0.05 using a one-way ANOVA, error bars represent SD.
Figure 2
Figure 2
Evolved dCas9 variants do not induce robust downregulation of HTT in HEK293 cells (A–C) HTT expression was assessed 72 h after treatment with (A) SpdCas9 CRISPRoff system, (B) VQR CRISPRoff system, and (C) dxCas9 CRISPRoff system. ∗p < 0.05 using a t test normalized to UG control. (D) ChIP-qPCR of dCas9 binding at HTT promoter, normalized to input. ∗p < 0.05 using a one-way ANOVA. (E) Paired qPCR analysis of HTT transcript levels in cells transfected with CRISPRoff and either sgRNA 6 or LacZ control. A fraction of the sample used for western blot analysis was allocated for RNA extraction. (F) Quantification of HTT protein levels by western blot across three replicates, normalized to β-actin. ∗∗∗∗p < 0.001 using a t test compared to LacZ control. (G) Representative western blot image of HTT in cells transfected with sgRNA 6 or LacZ control. Error bars represent SD.
Figure 3
Figure 3
CRISPRoff induces robust methylation of HTT (A) Methylation of CpGs in HTT promoter and gene body. ∗ represents values with over 25% differential methylation status using a Fisher’s exact test, p value with a Benjamin Hochberg correction. Each CpG site had approximately 100 reads. Cas9-gRNA icon denotes the binding site of CRISPRoff with sgRNA 6. (B) Average methylation of all CpG sites in the HTT promoter. (C) Average methylation of all CpG sites in the HTT 5′ UTR. (D) Average methylation of all CpG sites in exon 1 of HTT. (E) Average methylation of all CpG sites in intron 1 of HTT. (B–E) ∗∗∗∗p < 0.001 using a t test compared to unguided control. UG, unguided. Error bars reoresent SD.
Figure 4
Figure 4
RRBS shows few off-target effects on DNA methylation in 293s (A) Average promoter methylation of nearest neighbor gene, GRK4. (B) Number of genes with different ranges of hypermethylated CpGs. Error bars represent SD. (C) Venn diagram of predicted in silico off-target sites based upon sgRNA 6 sequence with genes with hypermethylated promoters (HMP). In silico off targets included regions with up to 3 mismatches and 2 DNA/RNA bulges via CRISPR RGEN. (D) Number of differentially methylated CpGs of genes found in both in silico predicted off-targets and hypermethylated promoters in Figure 4C.
Figure 5
Figure 5
CRISPRoff can induce long-term knockdown of HTT over 6 weeks in K562 cells (A) HTT expression 4 days post-treatment. ∗ < 0.05 using a t test normalized to UG control. (B) Time course of HTT knockdown in K562 cells. Normalized to UG at each time point. ∗ < 0.05 using a three-way ANOVA across time. (C) Relative CRISPRoff expression over time, normalized to ACTIN. ∗ < 0.05 using a t test normalized to LacZ control. (D) Paired qPCR analysis of HTT transcript levels in cells transfected with CRISPRoff and either sgRNA 6 or LacZ control. A fraction of the sample used for ChIP-qPCR analysis was allocated for RNA extraction. ∗∗p < 0.01 using a t test compared to LacZ control. (E) Input normalized H3K9me3 enrichment levels determined by ChIP-qPCR of the HTT promoter. ∗p < 0.05 using a using a t test compared to LacZ control. Error bars represent SD.
Figure 6
Figure 6
CRISPRoff induces knockdown of HTT expression in patient-derived NSCs (A) Schematic of differentiation of patient cells from fibroblasts to neuronal stem cells (NSCs). (B) Immunocytochemistry of ND36998C NSCs, nestin = green, Sox2 = red, NucBlue = blue. (C) HTT expression 48 h after nucleofection in ND36998G. Normalized to LacZ. ∗∗p < 0.01 using a one-way ANOVA, error bars represent SD.

References

    1. Kremer B., Goldberg P., Andrew S.E., Theilmann J., Telenius H., Zeisler J., Squitieri F., Lin B., Bassett A., Almqvist E. A Worldwide Study of the Huntington’s Disease Mutation: The Sensitivity and Specificity of Measuring CAG Repeats. N. Engl. J. Med. 1994;330:1401–1406. - PubMed
    1. Bates G.P. The molecular genetics of Huntington disease — a history. Nat. Rev. Genet. 2005;6:766–773. - PubMed
    1. Zhao Y., Zurawel A.A., Jenkins N.P., Duennwald M.L., Cheng C., Kettenbach A.N., Supattapone S. Comparative Analysis of Mutant Huntingtin Binding Partners in Yeast Species. Sci. Rep. 2018;8:9554. - PMC - PubMed
    1. Davies S.W., Turmaine M., Cozens B.A., DiFiglia M., Sharp A.H., Ross C.A., Scherzinger E., Wanker E.E., Mangiarini L., Bates G.P. Formation of Neuronal Intranuclear Inclusions Underlies the Neurological Dysfunction in Mice Transgenic for the HD Mutation. Cell. 1997;90:537–548. - PubMed
    1. Waldo J.J., Halmai J.A.N.M., Fink K.D. Epigenetic editing for autosomal dominant neurological disorders. Front. Genome Ed. 2024;6 - PMC - PubMed

LinkOut - more resources