

Residential greenness and diabetes incidence in two prospective cohorts of US women
- PMID: 40520480
- PMCID: PMC12160753
- DOI: 10.1097/EE9.0000000000000405
Residential greenness and diabetes incidence in two prospective cohorts of US women
Abstract
Background: Epidemiologic studies have associated higher neighborhood greenness with lower type 2 diabetes (T2D) risk. However, more work is needed to assess interrelationships between greenness, T2D risk factors, and T2D. Our aim was to prospectively evaluate the association between greenness and T2D incidence, and investigate effect modifiers, in the Nurses' Health Study (NHS) and Nurses' Health Study II (NHSII) cohorts of US women.
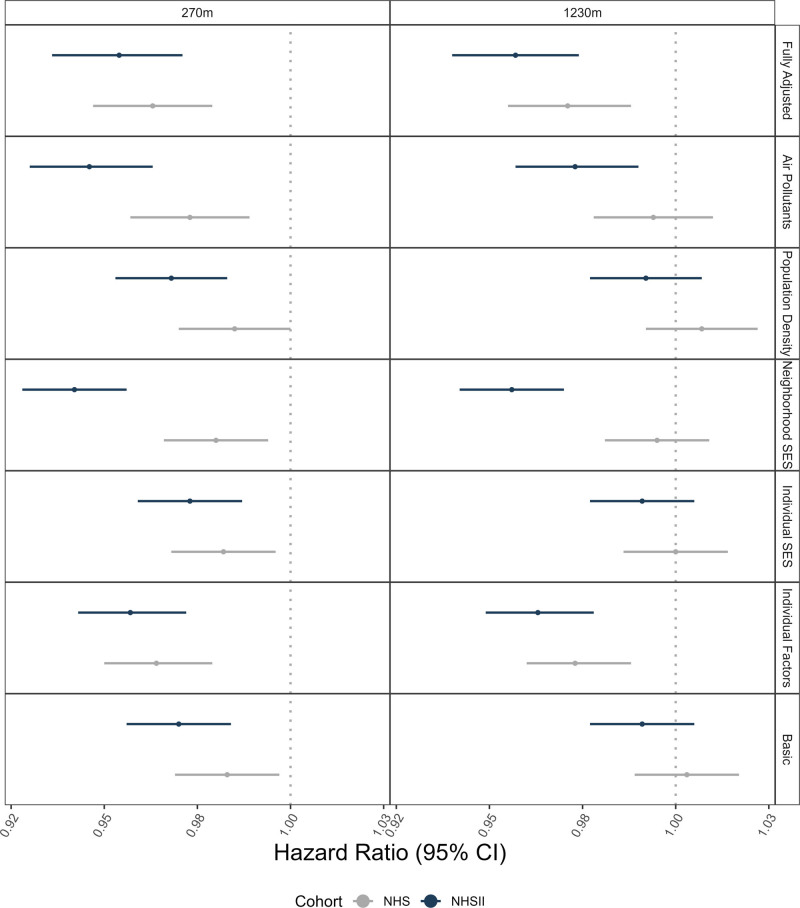
Methods: Greenness exposure was defined using the normalized difference vegetation index (NDVI), a quantitative indicator of photosynthetic vegetation. We obtained 30m2 resolution Landsat satellite data and calculated average NDVI within 270 m and 1230 m radial buffers to represent residential exposure and exposure within a short walk/drive using addresses from 1992 to 2017. We used time-varying Cox proportional hazards models to assess summer average NDVI in the 2 years before diagnosis and self-reported, validated clinician T2D diagnosis through 2019. We adjusted for time-varying covariates including lifestyle factors, hormone use, individual and neighborhood socioeconomic status (nSES), population density, particulate matter (PM)2.5 and nitrogen dioxide (NO2) exposure, and baseline body mass index (BMI). Results from the two cohorts (n = 212,548) were meta-analyzed. We examined effect modification by time-varying BMI, physical activity, smoking, region, air pollution, population density, and nSES. Supplemental analyses explored mediation by physical activity and air pollution.
Results: During the 27 years of follow-up, there were 18,527 incident T2D cases. In fully adjusted models, the meta-analyzed hazard ratio was 0.96 (95% confidence interval = 0.95, 0.97) for a 0.1 unit increase in 2-year summer average NDVI. In NHS, stronger associations were found among participants in the lowest PM2.5 tertile, and in NHSII, among those with BMI <30 and those in neighborhoods above the lowest nSES quartile.
Conclusions: In one of the first US nationwide prospective analyses of greenness and T2D, we found a protective association robust to air pollution co-exposure adjustment and persistent across subpopulations.
Copyright © 2025 The Authors. Published by Wolters Kluwer Health, Inc. on behalf of The Environmental Epidemiology. All rights reserved.
Conflict of interest statement
The authors declare that they have no conflicts of interest with regard to the content of this report.
Figures
Similar articles
-
Long-Term Exposure to Air Pollution and Incidence of Type 2 Diabetes in the Nurses' Health Study and Nurses' Health Study II.Environ Health Perspect. 2025 Jun;133(6):67009. doi: 10.1289/EHP15673. Epub 2025 Jun 12. Environ Health Perspect. 2025. PMID: 40314697 Free PMC article.
-
Mortality and Morbidity Effects of Long-Term Exposure to Low-Level PM2.5, BC, NO2, and O3: An Analysis of European Cohorts in the ELAPSE Project.Res Rep Health Eff Inst. 2021 Sep;2021(208):1-127. Res Rep Health Eff Inst. 2021. PMID: 36106702 Free PMC article.
-
Long-term exposure to residential surrounding greenness and incidence of diabetes: A prospective cohort study.Environ Pollut. 2022 Oct 1;310:119821. doi: 10.1016/j.envpol.2022.119821. Epub 2022 Jul 20. Environ Pollut. 2022. PMID: 35870530
-
The Association between Multiple Environmental Exposures and Symptoms of Generalized Anxiety Disorder in a Prospective, US-Based Cohort Study.Environ Health Perspect. 2025 Jun;133(6):67008. doi: 10.1289/EHP14458. Epub 2025 Jun 11. Environ Health Perspect. 2025. PMID: 40237568 Free PMC article.
-
Residential greenness and air pollution concerning excessive gestational weight gain during pregnancy: A cross-sectional study in Wuhan, China.Environ Res. 2023 Jan 15;217:114866. doi: 10.1016/j.envres.2022.114866. Epub 2022 Nov 23. Environ Res. 2023. PMID: 36427642
References
-
- International Diabetes Federation. IDF Diabetes Atlas. 11th edition. DiabetesAtlas. 2025. Available at: https://diabetesatlas.org/resources/idf-diabetes-atlas-2025/. Accessed 9 August 2021.
-
- Yang BY, Fan S, Thiering E, et al. Ambient air pollution and diabetes: a systematic review and meta-analysis. Environ Res. 2020;180:108817. - PubMed
-
- Liu F, Chen G, Huo W, et al. Associations between long-term exposure to ambient air pollution and risk of type 2 diabetes mellitus: a systematic review and meta-analysis. Environ Pollut. 2019;252:1235–1245. - PubMed
LinkOut - more resources
Full Text Sources