

Triglyceride-glucose indices predict all-cause mortality after stroke in NHANES 1999-2018
- PMID: 40520537
- PMCID: PMC12162973
- DOI: 10.3389/fnagi.2025.1617419
Triglyceride-glucose indices predict all-cause mortality after stroke in NHANES 1999-2018
Abstract
Objective: The present study explores the prognostic relevance of triglyceride-glucose-based indices in assessing post-stroke survival among affected individuals.
Methods: This study utilized a multifaceted analytical approach to assess how triglyceride-glucose-based indicators relate to death risk in stroke patients. This study was analyzed using a multivariate Cox proportional risk regression model incorporating sampling weights, while a restricted cubic spline function was introduced to assess trends in non-linear associations between exposure variables and outcomes. In addition, interaction terms were set and stratified analyses were conducted to verify the robustness and heterogeneity of the model results.
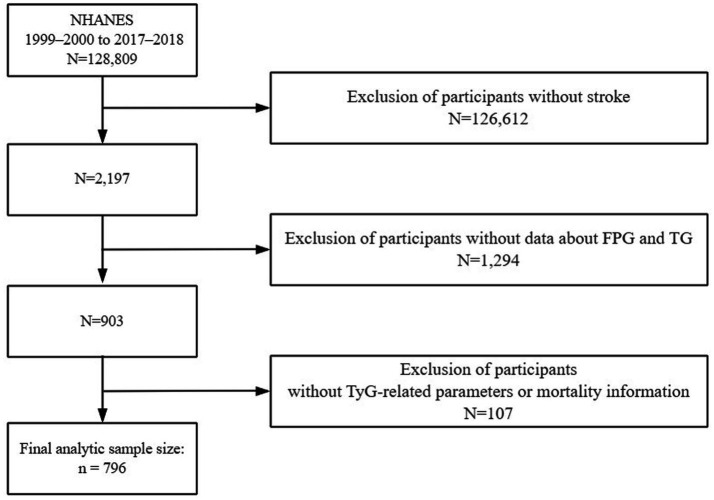
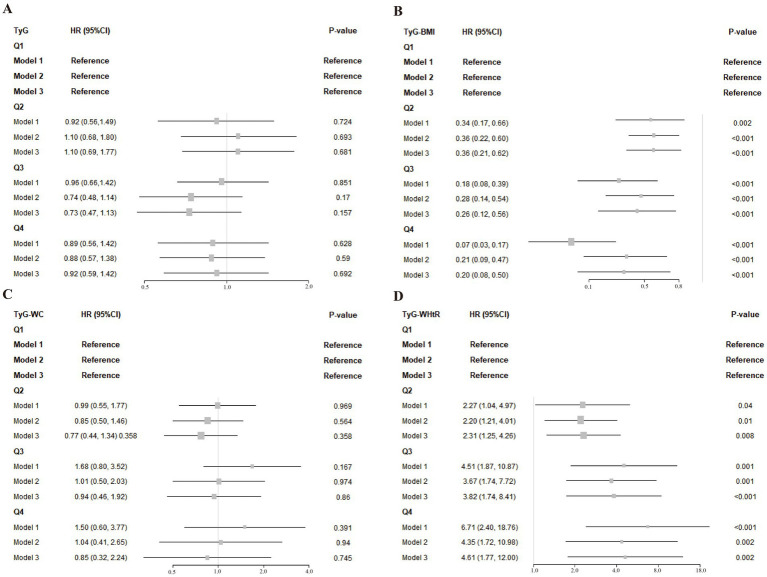
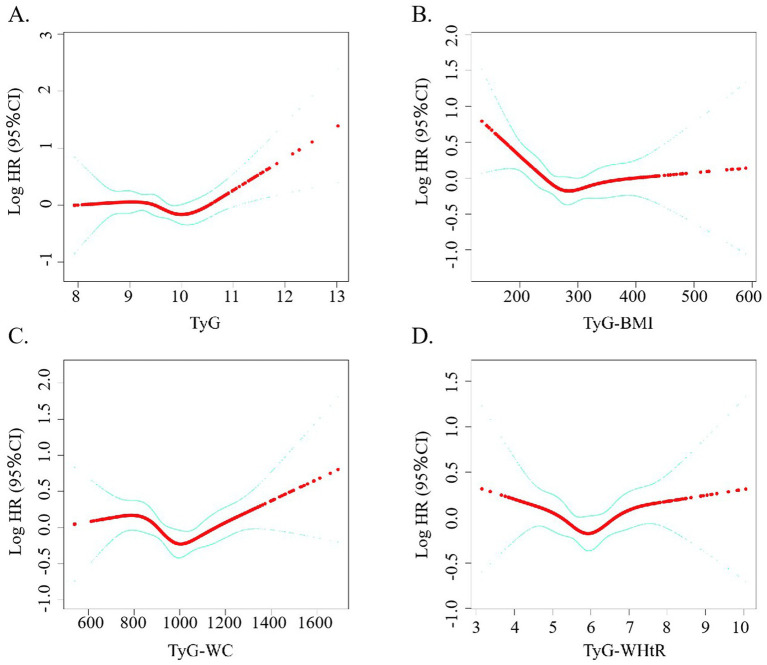
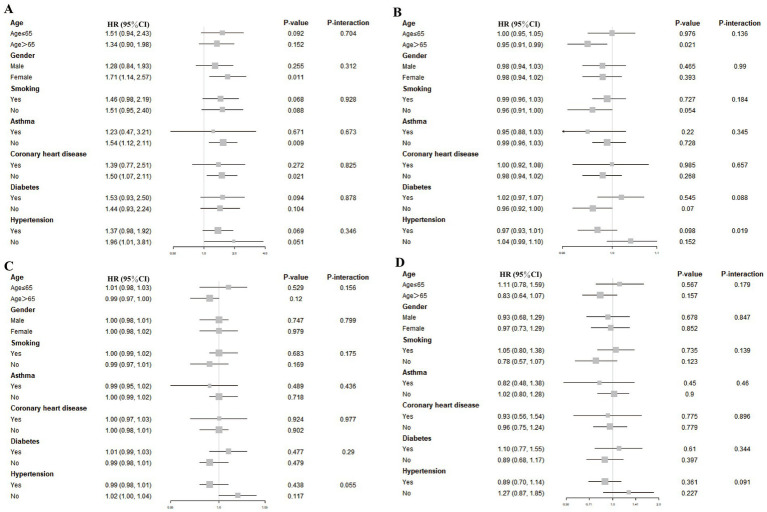
Results: This research ultimately included 796 individuals diagnosed with stroke. When adjusting for a wide range of potential confounders, those in the top TyG-BMI quartile exhibited the most pronounced reduction in mortality risk compared to individuals in the lowest category, with a hazard ratio of 0.20 (95% CI: 0.08-0.50), highlighting its protective potential across TyG-BMI. In contrast, individuals falling within the fourth quartile of the TyG-WHtR index demonstrated the strongest positive correlation with the risk of all-cause mortality (Hazard Ratio = 4.61, 95% CI: 1.77-12.00). Moreover, analysis using restricted cubic splines indicated a significant non-linear association between TyG-BMI levels and mortality outcomes (p < 0.05). No statistical interactions were observed between mortality outcomes and demographic or clinical variables including age, sex, smoking, asthma, coronary artery disease, diabetes, or hypertension across any TyG-related indices (p > 0.05).
Conclusion: The study outcomes suggest that stroke patients with reduced TyG-BMI and elevated TyG-WHtR levels tend to face increased mortality risks. Nonetheless, addressing obesity may be crucial in exploring potential causal pathways.
Keywords: NHANES; TyG-related index; mortality; retrospective cohort analysis; stroke.
Copyright © 2025 Zheng, Mao, Sang, Pan, Xie and Xie.
Conflict of interest statement
The authors declare that the research was conducted in the absence of any commercial or financial relationships that could be construed as a potential conflict of interest.
Figures
Similar articles
-
Association between triglyceride-glucose (TyG) related indices and cardiovascular diseases and mortality among individuals with metabolic dysfunction-associated steatotic liver disease: a cohort study of UK Biobank.Cardiovasc Diabetol. 2025 Jan 13;24(1):12. doi: 10.1186/s12933-024-02572-w. Cardiovasc Diabetol. 2025. PMID: 39806394 Free PMC article.
-
Long-term survival in stroke patients: insights into triglyceride-glucose body mass index from ICU data.Cardiovasc Diabetol. 2024 Apr 25;23(1):137. doi: 10.1186/s12933-024-02231-0. Cardiovasc Diabetol. 2024. PMID: 38664780 Free PMC article.
-
Association of triglyceride glucose-related parameters with all-cause mortality and cardiovascular disease in NAFLD patients: NHANES 1999-2018.Cardiovasc Diabetol. 2024 Jul 18;23(1):262. doi: 10.1186/s12933-024-02354-4. Cardiovasc Diabetol. 2024. PMID: 39026233 Free PMC article.
-
The association between triglyceride-glucose index combined with obesity indicators and stroke risk: A longitudinal study based on CHARLS data.BMC Endocr Disord. 2024 Nov 1;24(1):234. doi: 10.1186/s12902-024-01729-8. BMC Endocr Disord. 2024. PMID: 39487484 Free PMC article.
-
Association of triglyceride-glucose related indices with mortality among individuals with MASLD combined with prediabetes or diabetes.Cardiovasc Diabetol. 2025 Feb 1;24(1):52. doi: 10.1186/s12933-025-02616-9. Cardiovasc Diabetol. 2025. PMID: 39893457 Free PMC article.
References
LinkOut - more resources
Full Text Sources