. 2025 May 30:17:1579934.
doi: 10.3389/fnagi.2025.1579934. eCollection 2025.

Healthy aging in rats is associated with a decline in the ability to inhibit maladaptive responses, but not in measures of self-control by delayed gratification

Affiliations

Healthy aging in rats is associated with a decline in the ability to inhibit maladaptive responses, but not in measures of self-control by delayed gratification

Adam T Brockett et al. Front Aging Neurosci. .

Abstract

Introduction: While it is often assumed that aging is associated with a general decline in cognitive health and decision-making, behavioral and neural evidence suggests that this decline may not be as broad as once thought. Cognitive health can be measured in various ways but is often subdivided into our ability to adapt motor plans to rapidly changing sensory information (inhibitory control) as well as our ability to make effectively delay gratification (self-control).

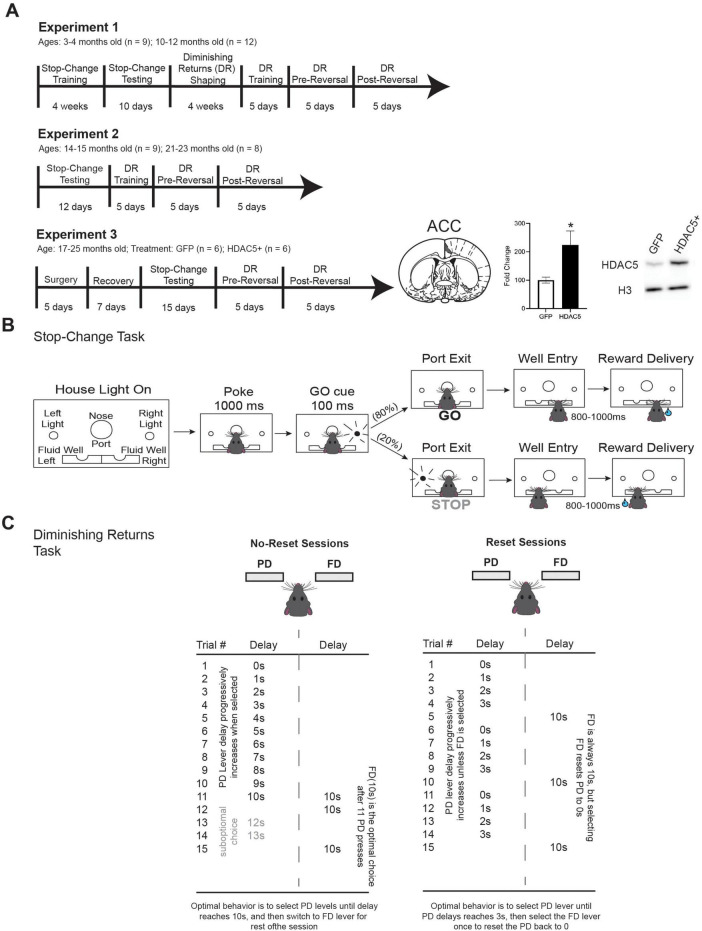
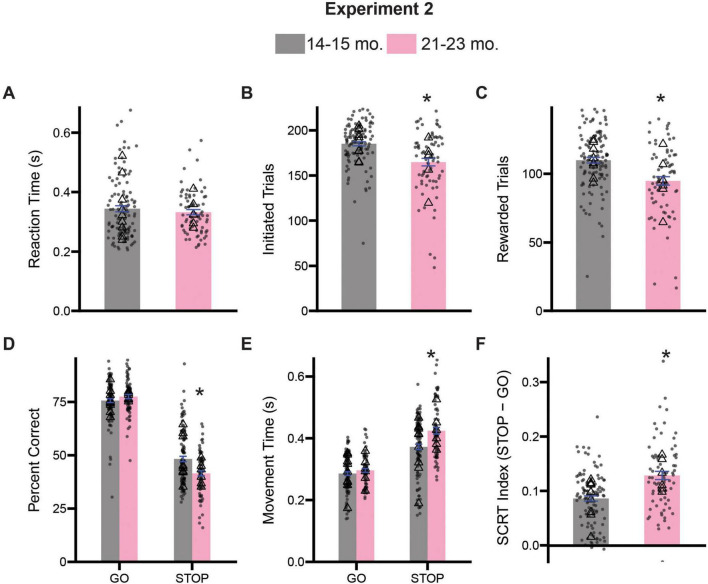
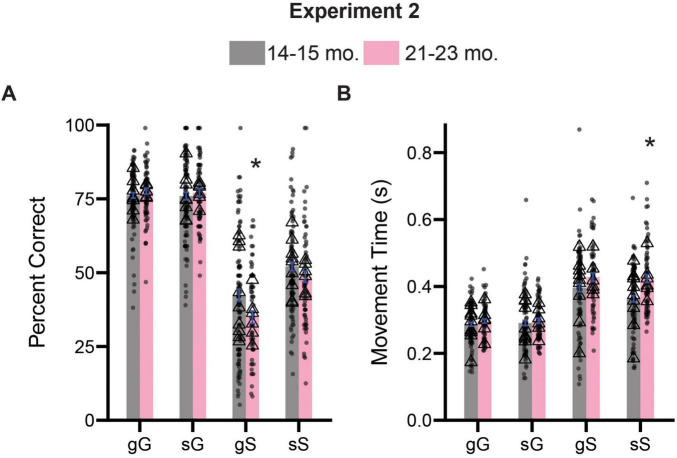
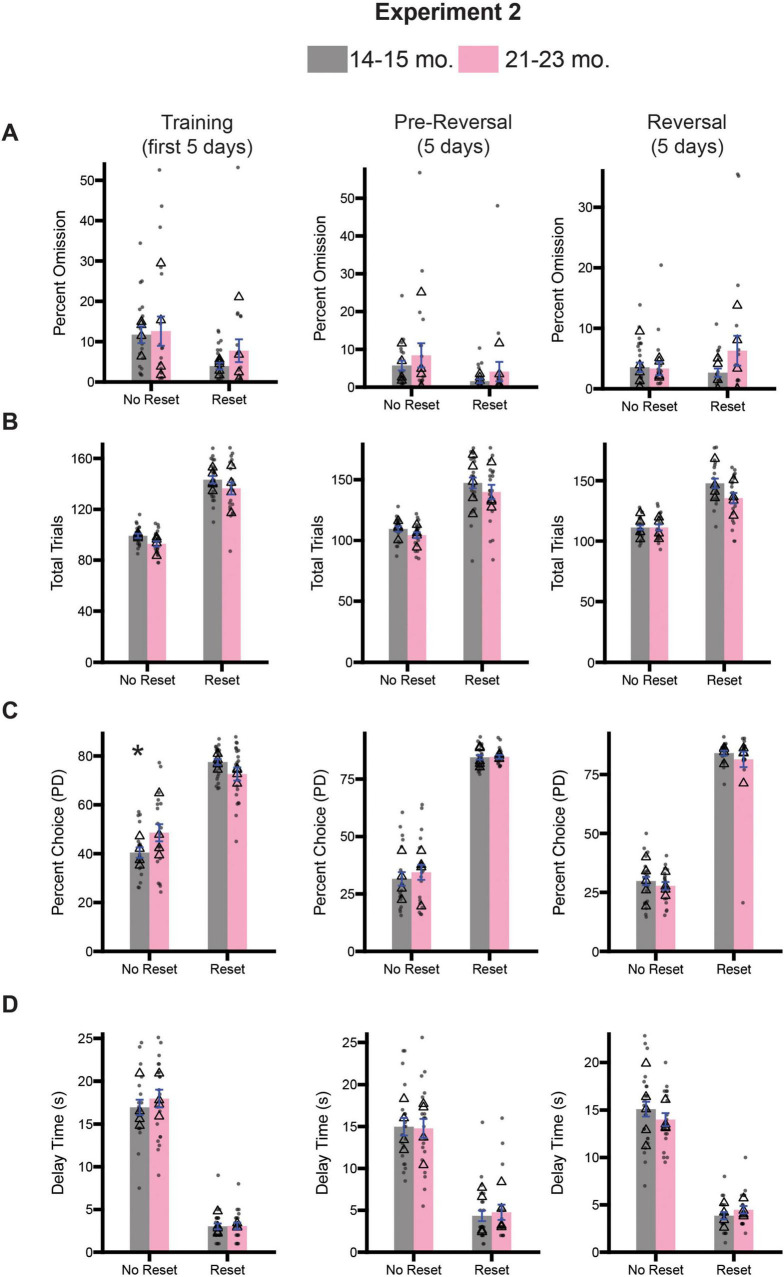
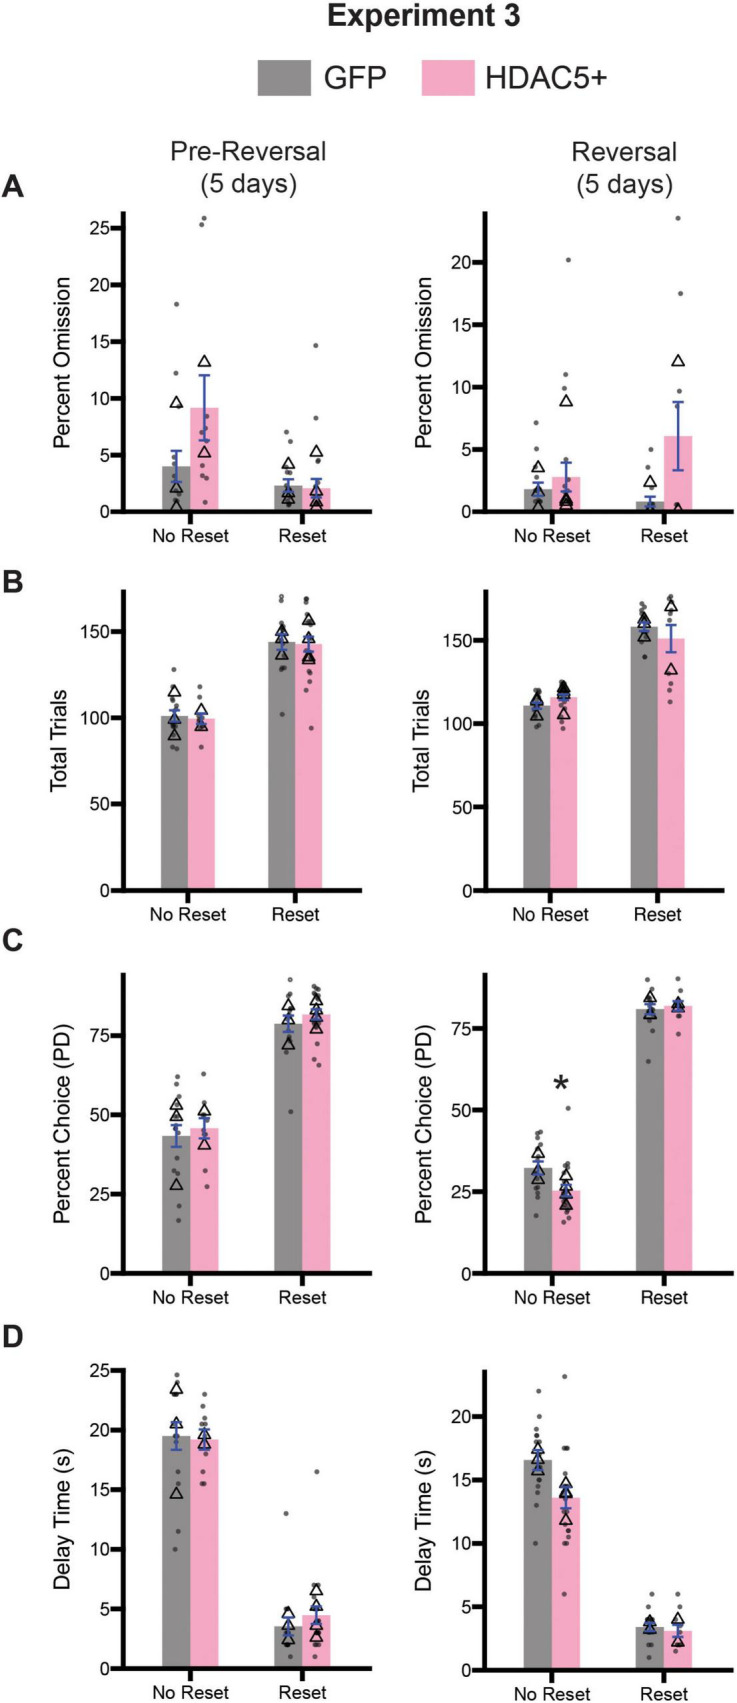
Methods: To examine how aging impacts these aspects of cognitive health across the lifespan, we tested rats of various ages on the stop-change task, a measure of inhibitory control, and reset and no-reset versions of the diminishing returns task, a measure of self-control by delayed gratification.

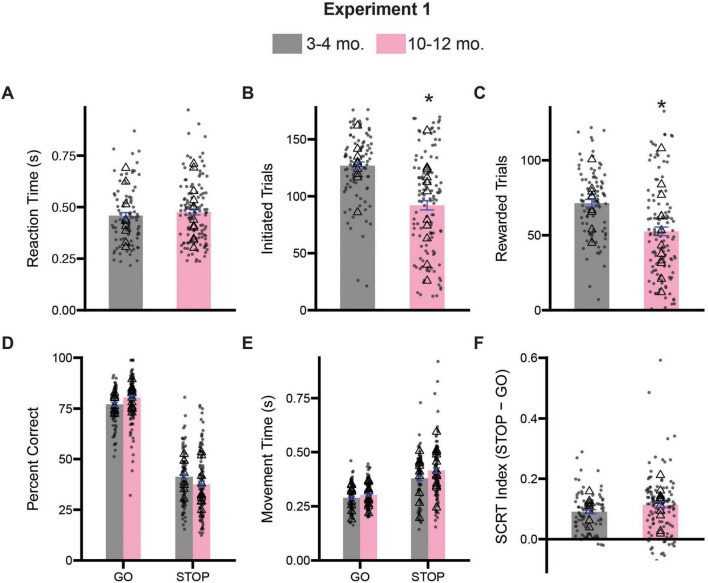
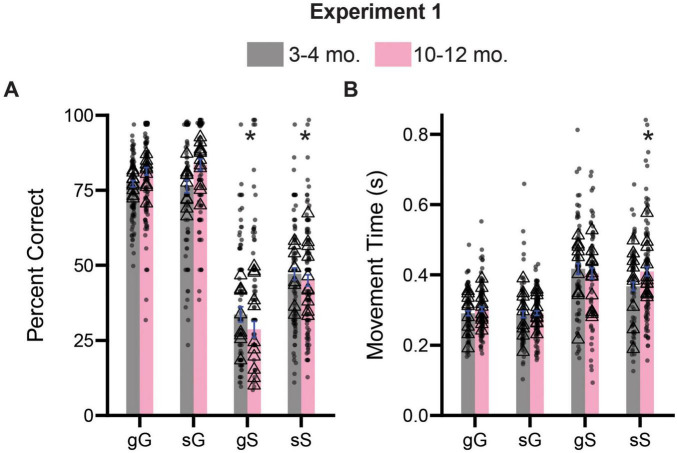
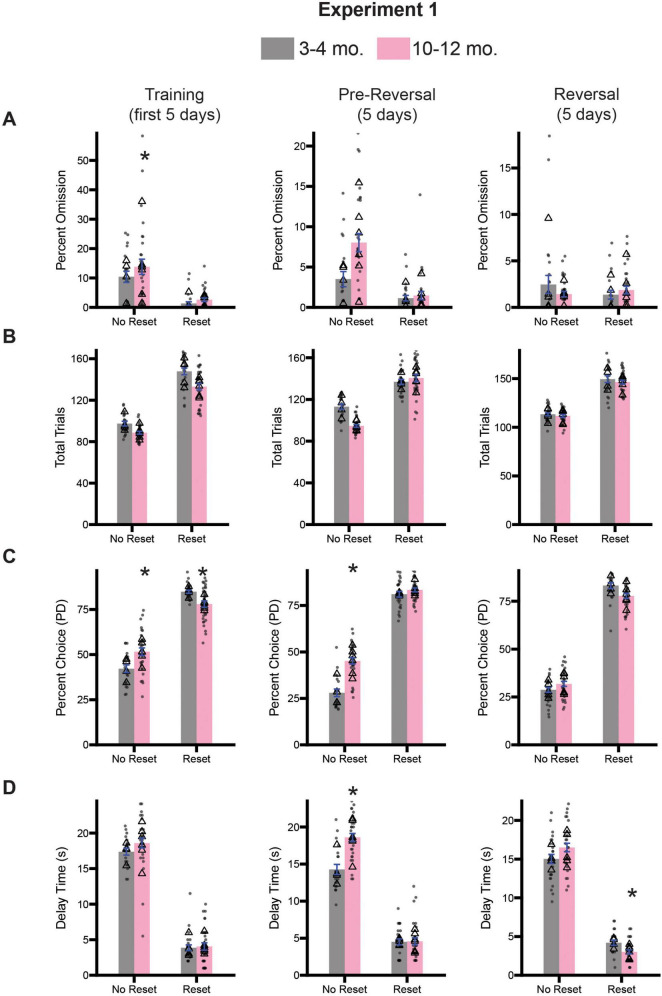
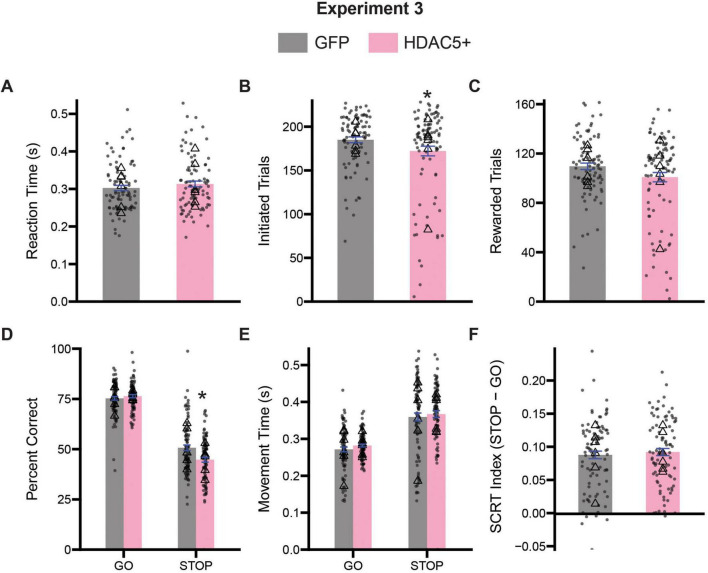
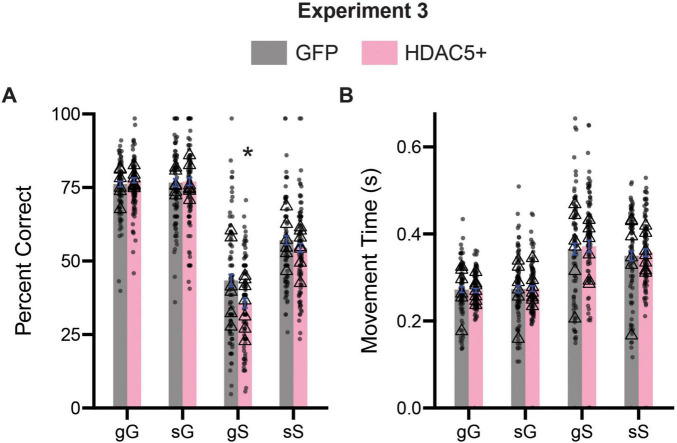
Results: In Experiment 1, we show that 10-12-month-old rats performed fewer trials compared to rats 3-4 months of age and exhibited significant differences in some measures of inhibitory, but not self, control as measured by diminishing returns. In Experiment 2, we show that 21-23-month-old rats show significant deficits in multiple measures of inhibitory control but largely resemble 14-15-month-old rats on measures of self-control. The results from both experiments highlight that aged rats tend to be less sensitive to delays in reward. Finally, we show that overexpression of an epigenetic enzyme (histone deacetylase 5)-thought to be elevated in aged individuals-worsens inhibitory control.

Conclusion: Across these experiments we show that the impact of aging on cognitive health is not unitary, in that aging negatively impacts the adaptation of motor actions independent of self-control.

Keywords: aging; cognition; cognitive control; cognitive health; reward.


Conflict of interest statement

The authors declare that the research was conducted in the absence of any commercial or financial relationships that could be construed as a potential conflict of interest.

Figures

FIGURE 1
FIGURE 1
Timeline and task design. (A) Experimental timeline. In Experiment 1, Rats were trained on the stop-change task and then tested for 10 days. Rats were then trained and tested on the diminishing returns task for an additional 10 days. In Experiment 2, the same rats were tested 11 months later both the stop-change task and diminishing returns task. In Experiment 3, rats from cohort 1 and 2 were combined into a single cohort, and the rats, now 17–25-months of age (n = 12), underwent bilateral virus injection surgery to target neurons in ACC with either GFP (control) or to increase HDAC5 expression (HDAC5 +). The fold increase in HDAC5 mRNA expression is displayed along with a schematic showing ACC and an example immunoblot image. *Indicated p < 0.05. (B) Schematic for stop-change task. Following the house lights rats made a nose poke for 200 ms before a light cue was illuminated on either the right or left side. On 80% of trials (GO trials) this light corresponded to the correct direction that rat needed to move to receive reward. On 20% of the trials a second light was illuminated after the initial GO cue directing the rat to inhibit their initial response to the first cue in favor of making a response in the direction of the second cue. (C) Schematic for the diminishing returns task. In the diminishing returns task, rats choose between two troughs. One delivers a reward after a fixed delay (FD), while the other delivers reward on a progressive delay (PD) schedule where the delay increases by 1 s with each entry into the trough. In the reset condition (right), the rat can reset the PD delay back to zero by entering the FD trough. In the no-reset condition (left), the PD delay continues to increase regardless of FD choice. In the reset condition, rats should switch between the FD and PD options prior to the PD delay reaching equality with the FD trough (10 s) to maximize the number of rewards they earn in a session.
FIGURE 2
FIGURE 2
Comparison stop-change performance between 3–4- and 10–12-month-old rats. (A) Comparison of reaction times (the time from the first cue presentation to port exit). (B) Comparison of the number of initiated trials. (C) Comparison of the average number of rewarded trials. (D) Two-way ANOVA (trial type x treatment) assessing accuracy. (E) Two-way ANOVA (trial type x treatment) assessing movement time (i.e., the time from center port exit to well entry). (F) Stop-change reaction time (SCRT) index assessing overall inhibitor overall inhibitory control. Bars represent mean ± SEM. *Indicated p < 0.05. Dots represent session performance for each animal. Triangles represent animal averages.
FIGURE 3
FIGURE 3
Comparison of trial experience on accuracy and movement times during Experiment 1. (A) Comparison of percent correct measures across gG, sG, gS, and sS trials. (B) Comparison of movement time measures across gG, sG, gS, and sS trials. Lower case “g” or “s” represent previous trial type (i.e., GO or STOP), upper case “G” or “S” represent current trial type (i.e., GO or STOP). Bars represent mean ± SEM. *Indicated p < 0.05. Dots represent session performance for each animal. Triangles represent animal averages.
FIGURE 4
FIGURE 4
Comparison of diminishing return performance across training (days 1–5; left), pre-reversal (days 6–10; center), and reversal (days 11–15; right) for Experiment 1. (A) Comparison of percent omission for all three time points. (B) Comparison of the average number of trials performed for all three timepoints. (C) Comparison of the percentage of PD choices for all three timepoints. (D) Comparison of the average delay associated with pressing the PD for all three timepoints. Bars represent mean ± SEM. *Indicated p < 0.05. Dots represent session performance for each animal. Triangles represent animal averages.
FIGURE 5
FIGURE 5
Comparison stop-change performance between 14–15- and 21–23-month-old rats. (A) Comparison of reaction times (the time from the first cue presentation to port exit). (B) Comparison of the number of initiated trials. (C) Comparison of the average number of rewarded trials. (D) Two-way ANOVA (trial type x treatment) assessing accuracy. (E) Two-way ANOVA (trial type x treatment) assessing movement time (i.e., the time from center port exit to well entry). (F) Stop-change reaction time (SCRT) index assessing overall inhibitor overall inhibitory control. Bars represent mean ± SEM. *Indicated p < 0.05. Dots represent session performance for each animal. Triangles represent animal averages.
FIGURE 6
FIGURE 6
Comparison of trial experience on accuracy and movement times during Experiment 2. (A) Comparison of percent correct measures across gG, sG, gS, and sS trials. (B) Comparison of movement time measures across gG, sG, gS, and sS trials. Lower case “g” or “s” represent previous trial type (i.e., GO or STOP), upper case “G” or “S” represent current trial type (i.e., GO or STOP). Bars represent mean ± SEM. *Indicated p < 0.05. Dots represent session performance for each animal. Triangles represent animal averages.
FIGURE 7
FIGURE 7
Comparison of diminishing return performance across training (days 1–5; left), pre-reversal (days 6–10; center), and reversal (days 11-15; right) for Experiment 2. (A) Comparison of percent omission for all three time points. (B) Comparison of the average number of trials performed for all three timepoints. (C) Comparison of the percentage of PD choices for all three timepoints. (D) Comparison of the average delay associated with pressing the PD for all three timepoints. Bars represent mean ± SEM. *Indicated p < 0.05. Dots represent session performance for each animal. Triangles represent animal averages.
FIGURE 8
FIGURE 8
Comparison stop-change performance between GFP and HDAC5 overexpress (HDAC5 +) rats. (A) Comparison of reaction times (the time from the first cue presentation to port exit). (B) Comparison of the number of initiated trials. (C) Comparison of the average number of rewarded trials. (D) Two-way ANOVA (trial type x treatment) assessing accuracy. (E) Two-way ANOVA (trial type x treatment) assessing movement time (i.e., the time from center port exit to well entry). (F) Stop-change reaction time (SCRT) index assessing overall inhibitor overall inhibitory control. Bars represent mean ± SEM. *Indicated p < 0.05. Dots represent session performance for each animal. Triangles represent animal averages.
FIGURE 9
FIGURE 9
Comparison of trial experience on accuracy and movement times during Experiment 3. (A) Comparison of percent correct measures across gG, sG, gS, and sS trials. (B) Comparison of movement time measures across gG, sG, gS, and sS trials. Lower case “g” or “s” represent previous trial type (i.e., GO or STOP), upper case “G” or “S” represent current trial type (i.e., GO or STOP). Bars represent mean ± SEM. *Indicated p < 0.05. Dots represent session performance for each animal. Triangles represent animal averages.
FIGURE 10
FIGURE 10
Comparison of diminishing return performance across pre-reversal (days 1–5; center, and reversal (days 6–10; right) for Experiment 3. (A) Comparison of percent omission for all three time points. (B) Comparison of the average number of trials performed for all three timepoints. (C) Comparison of the percentage of PD choices for all three timepoints. (D) Comparison of the average delay associated with pressing the PD for all three timepoints. Bars represent mean ± SEM. *Indicated p < 0.05. Dots represent session performance for each animal. Triangles represent animal averages.

Similar articles

References

    1. Agis-Balboa R., Pavelka Z., Kerimoglu C., Fischer A. (2013). Loss of HDAC5 impairs memory function: Implications for Alzheimer’s disease. J. Alzheimers Dis. 33 35–44. 10.3233/JAD-2012-121009 - DOI - PubMed
    1. Balietti M., Conti F. (2022). Environmental enrichment and the aging brain: Is it time for standardization? Neurosci. Biobehav. Rev. 139:104728. 10.1016/j.neubiorev.2022.104728 - DOI - PubMed
    1. Beas B., Setlow B., Bizon J. (2013). Distinct manifestations of executive dysfunction in aged rats. Neurobiol. Aging 34 2164–2174. 10.1016/j.neurobiolaging.2013.03.019 - DOI - PMC - PubMed
    1. Bizon J., Gallagher M. (2003). Production of new cells in the rat dentate gyrus over the lifespan: Relation to cognitive decline. Eur. J. Neurosci. 18 215–219. 10.1046/j.1460-9568.2003.02733.x - DOI - PubMed
    1. Bizon J., LaSarge C., Montgomery K., McDermott A., Setlow B., Griffith W. (2009). Spatial reference and working memory across the lifespan of male Fischer 344 rats. Neurobiol. Aging 30 646–655. 10.1016/j.neurobiolaging.2007.08.004 - DOI - PMC - PubMed

LinkOut - more resources