. 2025 May 30:16:1555586.
doi: 10.3389/fneur.2025.1555586. eCollection 2025.

Construction of epilepsy diagnosis model based on cell senescence-related genes and its potential mechanism

Affiliations

Construction of epilepsy diagnosis model based on cell senescence-related genes and its potential mechanism

Xiangyao Gong et al. Front Neurol. .

Abstract

Introduction: Epilepsy is a chronic brain disease with a certain degree of neurodegeneration and is caused by abnormal discharges of neurons. The mechanism of cell senescence has garnered increasing attention in neurodegenerative diseases. However, the role of cell senescence in the onset and progression of epilepsy is unclear. Therefore, this study constructed a diagnostic model of epilepsy based on cellular senescence-related genes (CSRGs) to analyze their role in disease pathogenesis.

Methods: The differentially expressed genes (DEGs) were screened from the epileptic sample dataset of the gene expression omnibus (GEO) database, and the cellular senescence-related DEGs (CSRDEGs) related to epilepsy were identified by CSRGs crossover. The functional enrichment characteristics of CSRDEGs were analyzed using gene ontology (GO) and Kyoto encyclopedia of genes and genomes (KEGG) enrichment analyses. The differences in biological processes between high and low-risk groups were analyzed using gene set enrichment analysis (GSEA). For model construction, logistic regression, random forest, and least absolute shrinkage and selection operator (LASSO) regression were employed to identify key genes, including ribosomal protein S6 kinase alpha-3 (RPS6KA3), cathepsin D (CTSD), and zinc finger protein 101 (ZNF101). Subsequently, a multifactor logistic regression model was developed to evaluate the risk of epilepsy based on these screened genes.

Results: The model exhibited higher area under the curve (AUC) values in the GSE data sets 143272 and 32534, producing encouraging results. Finally, mRNA-miRNA and mRNA-transcription factors (TFs) networks revealed the potential regulatory mechanism of the selected critical genes in the disease.

Discussion: This study elucidated the possible process of cell senescence in epileptic diseases through bioinformatics analysis, offering a potential target for personalized diagnosis and precise treatment.

Keywords: bioinformatics analysis; cell senescence; diagnosis model; epilepsy; senescence-associated secretory phenotype.


Conflict of interest statement

The authors declare that the research was conducted in the absence of any commercial or financial relationships that could be construed as a potential conflict of interest.

Figures

Figure 1
Figure 1
Data to batch processing. (A,B) Boxplot of GSE143272 distribution of epilepsy dataset before (A) and after (B) going to batch. (C,D) Epilepsy dataset GSE32534 distribution boxplot before (C) and after (D) debatched. Light blue is the control group, and light red is the epilepsy group.
Figure 2
Figure 2
Differential gene expression analysis. (A,B) Volcano plot of differentially expressed genes analysis between epilepsy group and control group in GSE143272 (A) and GSE32534 dataset (B). (C) DEGs in GSE143272 and GSE32534 datasets, genes and CSRGs Venn diagram of all epilepsy samples in GSE4290 dataset. (D,E) Heat map of CSRDEGs in GSE143272 (D) and GSE32534 datasets (E). DEGs, differentially expressed genes; CSRGs, cellular senescence-related genes; CSRDEGs, cellular senescence-related differentially expressed genes. Light red is the epilepsy group; light blue is the control group. In the heat map, red represents high expression, and blue represents low expression.
Figure 3
Figure 3
GO and KEGG enrichment analysis of CSRDEGs. (A,B) GO and pathway enrichment analysis results of CSRDEGs bar graph (A) and bubble plot (B) show CC, MF and biological pathway. GO terms and KEGG terms are shown on the ordinate. (C–E) GO and pathway (KEGG) enrichment analysis results of CSRDEGs network diagram showing CC (C), MF (D), and KEGG (E). Pink nodes represent items, blue nodes represent molecules, and the lines represent the relationship between items and molecules. CSRDEGs, cellular senescence-related differentially expressed genes; GO, Gene Ontology; KEGG, Kyoto Encyclopedia of Genes and Genomes; CC, cellular component; MF, molecular function. The screening criteria for GO and pathway enrichment analysis were p-value <0.05 and FDR value (q-value) <0.25.
Figure 4
Figure 4
GSEA analysis of epilepsy. (A) GSEA mountain plot of 4 biological functions of dataset GSE143272. (B–E) Gene set enrichment analysis (GSEA) showed that all genes were significantly enriched in neutrophil degranulation (B), IL6 7 pathway (C), NABA ECM affiliated (D), and Dectin 2 family (E). GSEA, gene set enrichment analysis. The screening criteria of GSEA were adj. p-value <0.05 and FDR value (q-value) <0.25, and the p-value correction method was Benjamini–Hochberg (BH).
Figure 5
Figure 5
Screening of key genes. (A) Plot of model training error of RF algorithm. (B) MeanDecreaseGini scatter plot of CSRDEGs (in descending MeanDecreaseGini order). (C) Cross-validation error plot. (D) Diagnostic model plot of LASSO regression model. (E) Variable trajectory plot of LASSO regression model. (F) Forest plot of key genes in LASSO regression model. CSRDEGs, cellular senescence-related differentially expressed genes; LASSO, least absolute shrinkage and selection operator.
Figure 6
Figure 6
Interaction network analysis of key genes. (A) mRNA-miRNA interaction network of key genes. (B) mRNA-TF interaction network of key genes. TF, transcription factor. Orange is mRNA, pink is miRNA, and purple is TF.
Figure 7
Figure 7
Key genes to construct diagnostic. (A) Logistic regression model nomogram of key genes in the diagnostic multivariate logistic model based on dataset GSE143272. (B) Diagnostic ROC curve of risk score of diagnostic multivariate logistic model in data set GSE143272. (C) DCA plot of the key genes of the diagnostic multivariate logistic model based on dataset GSE143272. (D) Diagnostic ROC curve of risk score of diagnostic multivariate logistic model in dataset GSE32534. (E) Functional similarity map of key genes. (F) Chromosomal mapping of key genes. The ordinate of the DCA plot is the net benefit, and the abscissa is the probability threshold or threshold probability. DCA, decision curve analysis. ROC, receiver operating characteristic; AUC, area under the curve. The closer the AUC is to 1 in the ROC curve, the better the diagnostic performance. When AUC was above 0.9, the accuracy was high.
Figure 8
Figure 8
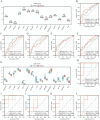
Validation analysis of differential expression of key genes. (A) Group comparison of key genes in the epilepsy group and the control group of dataset GSE143272. (B–F) Key genes RPS6KA3, CTSD, and NCAM1 (B), CREG1, CPVL, and TNFRSF1A (C), PECAM1, IL7R, and ZNF101 (D), RRM2B, MARCKSL1, and MCM3 (E), ATP7A, ROC curves of MAP2K4 and TNC (F) in dataset GSE143272. (G) Group comparison diagram of key genes in dataset GSE32534 epilepsy and control groups. (H–L) Key genes: RPS6KA3, CTSD, and NCAM1 (H), CREG1, CPVL, and TNFRSF1A (I), PECAM1, IL7R, and ZNF101 (J), RRM2B, MARCKSL1, and MCM3 (K), ATP7A, GSE32534 ROC curves of MAP2K4 and TNC (L) in dataset GSE32534. *Represents p-value <0.05, indicating statistical significance. **Represents p-value <0.01, highly statistically significant. ***Represents p-value <0.001 and highly statistically significant. When AUC >0.5, it indicates that the molecule’s expression is a trend to promote the event’s occurrence, and the closer the AUC is to 1, the better the diagnostic effect. AUC between 0.5 and 0.7 had low accuracy, AUC between 0.7 and 0.9 had moderate accuracy, and AUC above 0.9 had high accuracy. DCA, decision curve analysis; ROC, receiver operating characteristic; AUC, area under the curve; TPR, true positive rate; FPR, false positive rate. Light blue represents the control group, and light red represents the epilepsy group.
Figure 9
Figure 9
GSEA analysis of the high and low-risk groups of epilepsy. (A) GSEA mountain plot of four biological functions of dataset GSE4290. (B–E) GSEA showed that all genes were significantly enriched in neuronal system (B), anti inflammatory response GABA receptor signaling (C), and anti-inflammatory response GABA receptor signaling (C). Neurotransmitter receptors and postsynaptic signal transmission (D), neuroactive ligand receptor interaction (E). GSEA, gene set enrichment analysis. The screening criteria of GSEA were adj. p-value <0.05 and FDR value (q-value) <0.25, and the p-value correction method was BH.

Similar articles

References

    1. Falco-Walter J. Epilepsy-definition, classification, pathophysiology, and epidemiology. Semin Neurol. (2020) 40:617–23. doi: 10.1055/s-0040-1718719, PMID: - DOI - PubMed
    1. Thijs RD, Surges R, O’Brien TJ, Sander JW. Epilepsy in adults. Lancet. (2019) 393:689–701. doi: 10.1016/S0140-6736(18)32596-0, PMID: - DOI - PubMed
    1. Wang Y, Kuca K, You L, Nepovimova E, Heger Z, Valko M, et al. The role of cellular senescence in neurodegenerative diseases. Arch Toxicol. (2024) 98:2393–408. doi: 10.1007/s00204-024-03768-5, PMID: - DOI - PMC - PubMed
    1. Baker DJ, Petersen RC. Cellular senescence in brain aging and neurodegenerative diseases: evidence and perspectives. J Clin Invest. (2018) 128:1208–16. doi: 10.1172/JCI95145, PMID: - DOI - PMC - PubMed
    1. Dorigatti AO, Riordan R, Yu Z, Ross G, Wang R, Reynolds-Lallement N, et al. Brain cellular senescence in mouse models of Alzheimer’s disease. GeroScience. (2022) 44:1157–68. doi: 10.1007/s11357-022-00531-5, PMID: - DOI - PMC - PubMed

LinkOut - more resources