

Impact of concurrent aerobic and resistance training on body composition, lipid metabolism and physical function in patients with type 2 diabetes and overweight/obesity: a systematic review and meta-analysis
- PMID: 40520633
- PMCID: PMC12166852
- DOI: 10.7717/peerj.19537
Impact of concurrent aerobic and resistance training on body composition, lipid metabolism and physical function in patients with type 2 diabetes and overweight/obesity: a systematic review and meta-analysis
Abstract
Background: The potential advantages of concurrent aerobic and resistance training (CART) for enhancing cardiometabolic health-related outcomes appear to surpass the outcomes of engaging in aerobic or resistance training alone. The present study aimed to synthesize the available scientific evidence on the effects of CART on body composition, lipid metabolism, and physical function in patients with type 2 diabetes and overweight/obesity.
Methods: PubMed, Scopus, ScienceDirect, Cochrane Library, and Google Scholar were searched from inception to August 7, 2024. The review focused on randomized controlled trials and controlled clinical trials of CART. The Cochrane risk of bias tool was used to assess eligible studies, and the GRADE method to evaluate the reliability of evidence. A random-effects model was used and data were analyzed using standardized mean differences (SMD) and 95% confidence intervals (CI).
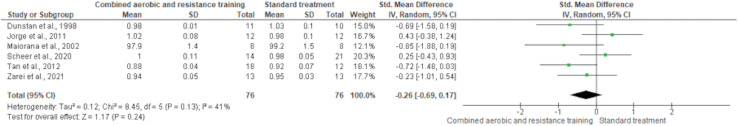
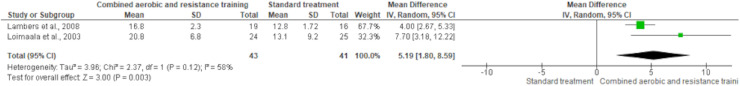
Results: A total of 22,878 studies were retrieved; only 20 studies were included, and data were extracted from 1,289 participants (57.0 ± 7.0 years; 31.1 ± 4.6 kg/m2) who met the eligibility criteria. CART group significantly reduced body fat percentage (SMD -0.42, 95% CI [-0.70 to -0.15]), low-density lipoprotein-cholesterol (SMD -0.32, 95% CI [-0.62 to -0.02]), triglycerides (SMD -0.48, 95% CI [-0.71 to -0.24]), total cholesterol (SMD -0.35, 95% CI [-0.58 to -0.12]), and fasting blood glucose levels compared to standard treatment (non-exercising controls). CART significantly increased high-density lipoprotein-cholesterol (SMD 0.44, 95% CI [0.05-0.82]) and improved physical function (cardiorespiratory fitness: SMD 78.78, 95% CI [46.30-111.25]; muscular fitness: SMD 5.19, 95% CI [1.80-8.59]) compared to standard treatment. There were no significant differences in body mass, waist-to-hip ratio, fat mass, and lean body mass between CART and standard treatment. An uncertain risk of bias and poor quality of evidence were observed in the eligible studies.
Conclusions: The present results indicate clear evidence that CART has a beneficial role in the improvement of several cardiometabolic health-related parameters in patients with type 2 diabetes and concomitant overweight/obesity. More trials with robust methodological design are needed to investigate the dose-response effects, training parameters formation, and potential mechanisms.
Keywords: Aerobic exercise; Cardiometabolic health; Metabolic syndrome; Obesity; Overweight; Resistance training.
© 2025 AL-Mhanna et al.
Conflict of interest statement
The authors declare that they have no competing interests.
Figures


Similar articles
-
Combined Aerobic and Resistance Training Improves Body Composition, Alters Cardiometabolic Risk, and Ameliorates Cancer-Related Indicators in Breast Cancer Patients and Survivors with Overweight/Obesity: A Systematic Review and Meta-Analysis of Randomized Controlled Trials.J Sports Sci Med. 2024 Jun 1;23(2):366-395. doi: 10.52082/jssm.2024.366. eCollection 2024 Jun. J Sports Sci Med. 2024. PMID: 38841642 Free PMC article.
-
Physical exercise training interventions for children and young adults during and after treatment for childhood cancer.Cochrane Database Syst Rev. 2016 Mar 31;3(3):CD008796. doi: 10.1002/14651858.CD008796.pub3. Cochrane Database Syst Rev. 2016. PMID: 27030386 Free PMC article.
-
Physical activity, diet and other behavioural interventions for improving cognition and school achievement in children and adolescents with obesity or overweight.Cochrane Database Syst Rev. 2018 Mar 2;3(3):CD009728. doi: 10.1002/14651858.CD009728.pub4. Cochrane Database Syst Rev. 2018. PMID: 29499084 Free PMC article.
-
Physical activity, diet and other behavioural interventions for improving cognition and school achievement in children and adolescents with obesity or overweight.Cochrane Database Syst Rev. 2018 Jan 29;1(1):CD009728. doi: 10.1002/14651858.CD009728.pub3. Cochrane Database Syst Rev. 2018. Update in: Cochrane Database Syst Rev. 2018 Mar 02;3:CD009728. doi: 10.1002/14651858.CD009728.pub4. PMID: 29376563 Free PMC article. Updated.
-
Exercise interventions on health-related quality of life for people with cancer during active treatment.Cochrane Database Syst Rev. 2012 Aug 15;2012(8):CD008465. doi: 10.1002/14651858.CD008465.pub2. Cochrane Database Syst Rev. 2012. PMID: 22895974 Free PMC article.
Cited by
-
Comparative effectiveness of high-intensity interval training and moderate-intensity continuous training on cardiometabolic health in patients with diabesity: a systematic review and meta-analysis of randomized controlled trials.Diabetol Metab Syndr. 2025 Aug 13;17(1):331. doi: 10.1186/s13098-025-01909-z. Diabetol Metab Syndr. 2025. PMID: 40804647 Free PMC article. Review.
References
-
- Afolabi HA, Zakaria Z, Salleh SM, Ch’ng ES, Nafi SNM, Aziz AABA, Al-Mhanna SB, Irekeola AA, Wada Y, Daku AB. Obesity-Recent Insights and Therapeutic. London, UK: IntechOpen; 2023. Obesity: a prerequisite for major chronic illnesses.
-
- Al-Mhanna SB, Batrakoulis A, Mohamed M, Alkhamees NH, Sheeha BB, Ibrahim ZM, Aldayel A, Muhamad AS, Rahman SA, Afolabi HA, Zulkifli MM, Hafiz Bin Hanafi M, Abubakar BD, Rojas-Valverde D, Ghazali WSW. Home-based circuit training improves blood lipid profile, liver function, musculoskeletal fitness, and health-related quality of life in overweight/obese older adult patients with knee osteoarthritis and type 2 diabetes: a randomized controlled trial during the COVID-19 pandemic. BMC Sports Science, Medicine and Rehabilitation. 2024a;16(1):125. doi: 10.1186/s13102-024-00915-4. - DOI - PMC - PubMed
-
- Al-Mhanna SB, Batrakoulis A, Wan Ghazali WS, Mohamed M, Aldayel A, Alhussain MH, Afolabi HA, Wada Y, Gulu M, Elkholi S, Abubakar BD, Rojas-Valverde D. Effects of combined aerobic and resistance training on glycemic control, blood pressure, inflammation, cardiorespiratory fitness and quality of life in patients with type 2 diabetes and overweight/obesity:a systematic review and meta-analysis. PeerJ. 2024b;12(1):e17525. doi: 10.7717/peerj.17525. - DOI - PMC - PubMed
-
- Al-Mhanna SB, Franklin BA, Jakicic JM, Stamatakis E, Pescatello LS, Riebe D, Thompson WR, Skinner J, Colberg SR, Alkhamees NH, Bin Sheeha B, Gulu M, Alghannam AF, Batrakoulis A. Impact of resistance training on cardiometabolic health-related indices in patients with type 2 diabetes and overweight/obesity: a systematic review and meta-analysis of randomised controlled trials. British Journal of Sports Medicine. 2025;59(10):733–746. doi: 10.1136/bjsports-2024-108947. - DOI - PubMed
-
- Al-Mhanna SB, Ghazali WSW, Mohamed M, Rabaan AA, Santali EY, Alestad JH, Santali EY, Arshad S, Ahmed N, Afolabi HA. Effectiveness of physical activity on immunity markers and quality of life in cancer patient: a systematic review. PeerJ. 2022a;10(3):e13664. doi: 10.7717/peerj.13664. - DOI - PMC - PubMed
Publication types
MeSH terms
LinkOut - more resources
Full Text Sources
Medical
Miscellaneous
