

Evaluation and transcriptomic and metabolomic analysis of the ability of Auricularia heimuer to utilize crop straw
- PMID: 40520637
- PMCID: PMC12166850
- DOI: 10.7717/peerj.19300
Evaluation and transcriptomic and metabolomic analysis of the ability of Auricularia heimuer to utilize crop straw
Abstract
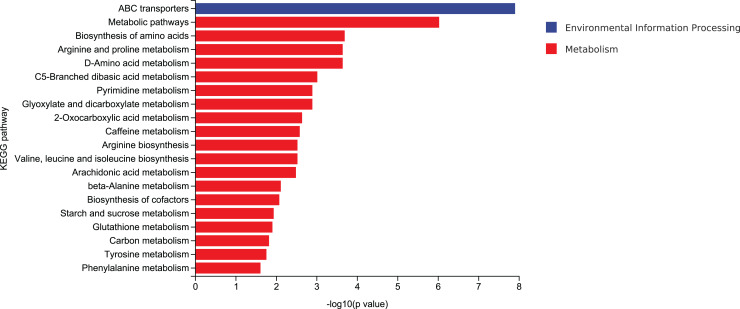
Auricularia heimuer is an important edible fungus, and the choice of its cultivation medium is very important to improve the yield and quality. Traditionally, A. heimuer mostly uses wood chips as cultivation substrate, but with the increase of agricultural waste, exploring agricultural straw as an alternative substrate has become a research hotspot. In this study, a wild A. heimuer strain W-ZD22 with good adaptability to straw matrix was used to measure mycelia growth characteristics and extracellular enzyme activity. Transcriptomics and non-targeted metabolomics methods were used to compare the effects of mycelia using agricultural straw matrix and wood chips matrix. It was found that the lignin enzyme activities of corn straw and wood chips were similar. By transcriptomic and metabolomic analysis, we further analyzed the transcription profiles of A. heimuer mycelia grown in different substrates (straw and corn stalk, straw and sawdust, corn stalk and sawdust), and identified 5,149, 2,740 and 2,933 different expression genes (DEGs), respectively. The three control groups had a total of 526 gene variants. The top 20 pathways with the highest concentration of DEGs mainly involved glyoxylate and dicarboxylate metabolism, glycine, serine and threonine metabolism, glycolysis/gluconeogenesis, pyruvate metabolism, oxidative phosphorylation, endoplasmic reticulum protein processing and ribosome. In order to further understand the similarity of enzyme activity of Auricularia mycelium on corn stalk and wood chips, metabolomic analysis of substrate of corn stalk and wood chips was conducted. It was found that different metabolites were significantly enriched in starch and sucrose metabolism, glutathione metabolism, carbon metabolism and other pathways, which provided theoretical basis for efficient comprehensive utilization of corn stalk in auricularia growth.
Keywords: Auricularia heimuer; Crop straw; Metabolomics; Transcriptomics.
© 2025 Zhang et al.
Conflict of interest statement
The authors declare that they have no competing interests.
Figures


Similar articles
-
Transcriptomic, and metabolic profiling reveals adaptive mechanisms of Auricularia heimuer to temperature stress.PeerJ. 2025 Jul 21;13:e19713. doi: 10.7717/peerj.19713. eCollection 2025. PeerJ. 2025. PMID: 40708823 Free PMC article.
-
Whole genome sequence of Auricularia heimuer (Basidiomycota, Fungi), the third most important cultivated mushroom worldwide.Genomics. 2019 Jan;111(1):50-58. doi: 10.1016/j.ygeno.2017.12.013. Epub 2017 Dec 27. Genomics. 2019. PMID: 29288711
-
Research progress of Auricularia heimuer on cultivation physiology and molecular biology.Front Microbiol. 2022 Nov 10;13:1048249. doi: 10.3389/fmicb.2022.1048249. eCollection 2022. Front Microbiol. 2022. PMID: 36439811 Free PMC article. Review.
-
A Combination of Transcriptome and Enzyme Activity Analysis Unveils Key Genes and Patterns of Corncob Lignocellulose Degradation by Auricularia heimuer under Cultivation Conditions.J Fungi (Basel). 2024 Aug 3;10(8):545. doi: 10.3390/jof10080545. J Fungi (Basel). 2024. PMID: 39194871 Free PMC article.
-
Bioreactors for lignocellulose conversion into fermentable sugars for production of high added value products.Appl Microbiol Biotechnol. 2016 Jan;100(2):597-611. doi: 10.1007/s00253-015-7125-9. Epub 2015 Nov 16. Appl Microbiol Biotechnol. 2016. PMID: 26572518 Free PMC article. Review.
References
-
- Cai Y, Weng K, Guo Y, Peng J, Zhu Z-J. An integrated targeted metabolomic platform for high-throughput metabolite profiling and automated data processing. Metabolomics. 2015;11(6):1575–1586. doi: 10.1007/s11306-015-0809-4. - DOI
MeSH terms
Substances
LinkOut - more resources
Full Text Sources
