. 2025 May 25;15(5):2413-2426.
doi: 10.62347/NHFJ1535. eCollection 2025.

The complex interplay of TROP2 and PD-L1 in immune regulation and drug resistance in lung cancer

Affiliations

The complex interplay of TROP2 and PD-L1 in immune regulation and drug resistance in lung cancer

Chih-Jen Yang et al. Am J Cancer Res. .

Abstract

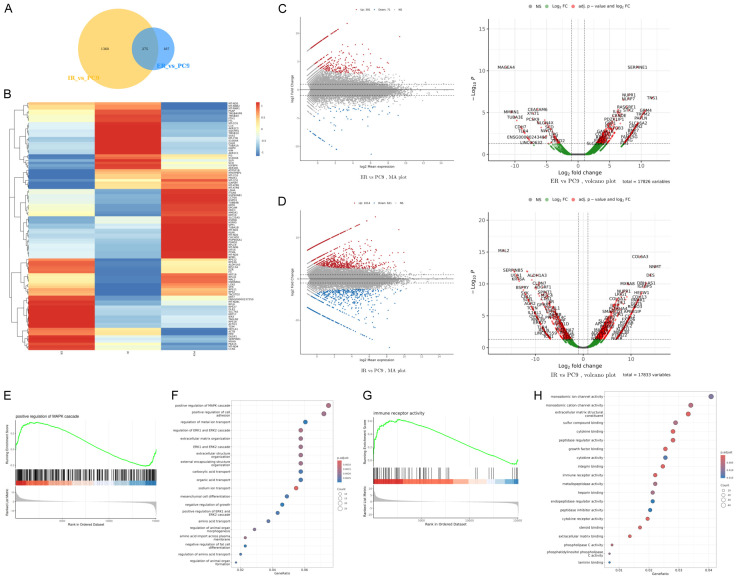
The complex interplay of TROP2 and PD-L1 in lung adenocarcinoma (LUAD) influences drug resistance and immunotherapy efficacy remains incompletely understood yet. In this study, we investigated the relationship between TACSTD2 (encoding TROP2) and PD-L1 expression through transcriptome analysis, immunohistochemistry, and single-cell RNA sequencing in lung cancer cell lines, tumor tissues, and immune cells, focusing on PC9 parental and drug-resistant variants. TACSTD2 expression strongly correlated with poor clinical outcomes, particularly in immunotherapy-treated patients (HR 1.71 for OS, 2.95 for PFS). Our transcriptome analysis revealed distinct resistance mechanisms involving MAPK signaling and immune receptor regulation pathways. Immunohistochemistry demonstrated significantly elevated TROP2 expression in tumor tissues compared to normal samples, with notably higher levels in PD-L1 positive specimens. We observed significant negative correlations between TACSTD2 expression and CD8+ T cell infiltration (Rho = -0.11, P = 1.44e-02), alongside positive correlations with cancer-associated fibroblasts (Rho = 0.094, P = 3.68e-02). Single-cell RNA sequencing identified two distinct cancer subtypes with differential TACSTD2 expression, while gene ontology analysis highlighted enrichment in cell adhesion and immune interaction pathways. These findings provide novel insights into the molecular mechanisms underlying TROP2 and PD-L1 interactions in LUAD, offering potential new diagnostic markers and therapeutic strategies through improved understanding of tumor microenvironment dynamics and resistance mechanisms.

Keywords: PD-L1; TROP2; drug resistance; immunotherapy; lung adenocarcinoma.


Conflict of interest statement

None.

Figures

Figure 1
Figure 1
TACSTD2 expression impacts survival outcomes and correlates with treatment resistance. (A) Box plot demonstrating significantly higher TACSTD2 expression in LUAD tumor samples (n = 483) compared to normal tissues (n = 347) (P < 0.05). (B, C) Kaplan-Meier analysis in general LUAD cohort shows patients with high TACSTD2 expression exhibit poorer overall survival (HR = 1.48, 95% CI: 1.25-1.76, P = 5.4e-06) (B) and progression-free survival (HR = 1.26, 95% CI: 1.12-1.42, P = 0.00018) (C) over 120 months. (D, E) This survival difference becomes more pronounced in immunotherapy-treated patients, with high TACSTD2 expression associated with markedly worse overall survival (HR = 1.71, 95% CI: 1.27-2.29, P = 0.00031) (D) and dramatically reduced progression-free survival (HR = 2.95, 95% CI: 2.14-4.07, P = 4.7e-12) (E) over 50 months. (F) Western blot analysis reveals differential expression patterns of TROP2 and PD-L1 across parental (PC9) and resistant (PC9-IR, PC9-ER) cell lines, with PC9-ER showing notably increased TROP2 expression while PC9-IR shows reduced expression compared to parental cells, suggesting resistance-specific regulation of these proteins.
Figure 2
Figure 2
Differential gene expression and pathway analysis in EGFR-TKI resistant lung cancer cell lines. (A) Venn diagram showing the overlap of differentially expressed genes between IR vs PC9 (yellow circle, 1340 unique genes) and ER vs PC9 (blue circle, 187 unique genes) comparisons, with 275 shared genes between both conditions. (B) Hierarchical clustering heatmap of the top 100 most variable genes across three experimental conditions (PC9, IR, and ER), with expression patterns clearly separating resistant from parental cells. (C) MA plot (left) and Volcano plot (right) of ER vs PC9 comparison, showing 621 upregulated and 465 downregulated genes (adjusted p-value < 0.05, |log2FC| > 1), with key upregulated genes including SERPINE1, MAGEA4, and TPM1. (D) MA plot and Volcano plot of IR vs PC9 comparison, revealing more extensive transcriptional changes with 834 upregulated and 45 downregulated genes, including significantly upregulated SALL2, SERPINB5, and ALDH1A3. (E-H) Pathway enrichment analysis showing distinct biological mechanisms in each resistance model: ER cells demonstrate significant enrichment of MAPK cascade regulation (E) along with cell adhesion, ERK/RAS signaling, and extracellular matrix organization (F), while IR cells show prominent enrichment of immune receptor activity (G), transmembrane receptor function, cytokine activity, and matrix binding (H). This analysis reveals MAPK signaling as predominant in erlotinib resistance and immune-related pathways in gefitinib resistance.
Figure 3
Figure 3
TROP2 expression patterns in PD-L1 null and positive lung adenocarcinoma tissues. A-D. Immunohistochemical staining of TROP2 in PD-L1 null lung adenocarcinoma samples. Four cases showing weak to moderate TROP2 staining. Scale bar = 100 μm. E-H. TROP2 staining in PD-L1 positive samples. Four cases demonstrating stronger, more widespread TROP2 expression. Scale bar = 100 μm. I. Quantitative analysis of TROP2 expression showing significantly higher integrated density in PD-L1 positive samples compared to PD-L1 null samples (***P < 0.001). J. Box plot comparing TROP2 expression in LUAD (n = 334) vs normal tissue (n = 20). Significantly higher TROP2 expression in LUAD (Wilcoxon test statistic = 21600, P = 1.36e-07). TROP2 expression is elevated in lung adenocarcinoma, with notably higher levels in PD-L1 positive tissues.
Figure 4
Figure 4
TACSTD2 expression correlates with distinct immune cell populations in lung adenocarcinoma. (A-I). The nine distinct plots reveal a complex landscape of correlations, with statistically significant associations emerging for specific immune cell subsets. Notably, CD8+ T cells (A, Rho = -0.11, P = 1.44e-02), CD4+ effector memory T cells (C, Rho = 0.092, P = 4.18e-02), CD8+ naive T cells (E, Rho = -0.135, P = 2.66e-03), and cancer-associated fibroblasts (G, Rho = 0.094, P = 3.68e-02) demonstrate significant correlations with TACSTD2 expression. In contrast, other immune cell populations such as CD4+ naive T cells, CD8+ effector memory T cells, M1 and M2 macrophages show non-significant correlations. Each plot provides a dual perspective, examining tumor purity and immune cell infiltration, with TACSTD2 expression levels (log2 TPM) serving as the primary variable of interest, ultimately painting a nuanced picture of the molecular interplay within the tumor microenvironment.
Figure 5
Figure 5
Single-cell analysis reveals distinct cancer subtypes and immune microenvironment alterations. A. Violin plot showing significantly higher TACSTD2 expression in Cancer II (alveolar-type) compared to Cancer I (SOX2+) cells (P < 0.001). B. UMAP visualization comparing normal versus tumor tissues cellular landscapes, with six identified populations: Cancer I (red), Cancer II (green), Helper CD4+ T cells (yellow), CD8+ T cells (turquoise), Naïve T cells (blue), and NK cells (pink). C. Cellular composition analysis shows cancer cells predominate in tumor samples (~60%), while normal tissues contain higher proportions of immune cells, particularly NK cells. D. Gene ontology analysis identifies significantly enriched pathways including leukocyte cell-cell adhesion, T cell activation, and antigen processing, suggesting TACSTD2 expression may influence tumor heterogeneity and immune microenvironment composition, potentially explaining differential immunotherapy responses.

Similar articles

References

    1. Zhou K, Li S, Zhao Y, Cheng K. Mechanisms of drug resistance to immune checkpoint inhibitors in non-small cell lung cancer. Front Immunol. 2023;14:1127071. - PMC - PubMed
    1. Bessede A, Peyraud F, Besse B, Cousin S, Cabart M, Chomy F, Rey C, Lara O, Odin O, Nafia I, Vanhersecke L, Barlési F, Guégan JP, Italiano A. TROP2 is associated with primary resistance to immune checkpoint inhibition in patients with advanced non-small cell lung cancer. Clin Cancer Res. 2024;30:779–785. - PMC - PubMed
    1. Stanley R, Flanagan S, Reilly DO, Kearney E, Naidoo J, Dowling CM. Immunotherapy through the lens of non-small cell lung cancer. Cancers. 2023;15:2996. - PMC - PubMed
    1. Ahmed Y, Berenguer-Pina JJ, Mahgoub T. The rise of the TROP2-targeting agents in NSCLC: new options on the horizon. Oncology. 2021;99:673–680. - PubMed
    1. Gu QZ, Nijiati A, Gao X, Tao KL, Li CD, Fan XP, Tian Z. TROP2 promotes cell proliferation and migration in osteosarcoma through PI3K/AKT signaling. Mol Med Rep. 2018;18:1782–1788. - PubMed

LinkOut - more resources