. 2025 May 25;15(5):2285-2300.
doi: 10.62347/DIMG6893. eCollection 2025.

Gut microbiota is associated with the disease characteristics of patients with newly diagnosed diffuse large B-cell lymphoma

Affiliations

Gut microbiota is associated with the disease characteristics of patients with newly diagnosed diffuse large B-cell lymphoma

Zheng Li et al. Am J Cancer Res. .

Abstract

Objective: To investigate the relationship between the gut microbiota and the biological characteristics of patients with newly diagnosed diffuse large B-cell lymphoma (DLBCL).

Methods: This prospective study included 71 patients with newly diagnosed DLBCL. The microbiota was analyzed using 16S ribosomal DNA sequencing of fecal samples. Blood cytokines, PD-1, and PD-L1 were measured by enzyme-linked immunosorbent assay. Stratified analyses based on clinical characteristics were conducted to investigate correlations between alterations in gut microbiota and key clinicopathological parameters of DLBCL.

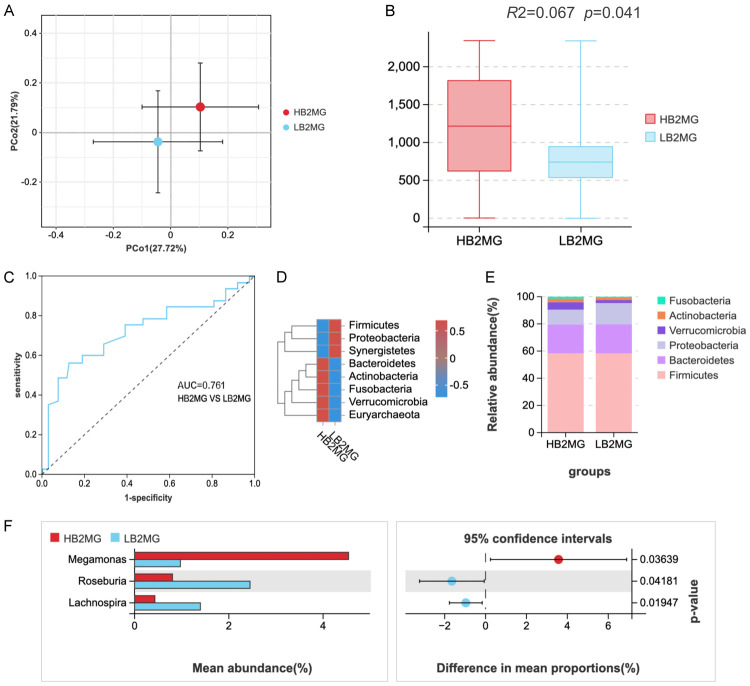
Results: In the analysis of gut microbiota heterogeneity (α diversity index), species abundance was significantly higher in the International Prognostic Index (IPI) < 3 group compared to the IPI ≥ 3 group (high-risk group). Ruminococcus was increased in the IPI ≥ 3 group. Parabacteroides, Ruminococcus, and Eubacterium were increased in the non-germinal center B-cell-like group, while Lachnospira was decreased. Megamonas was significantly increased in the high β2-microglobulin group, while Lactobacillus reuteri and Lachnospira were decreased. In the low CD4+/CD8+ ratio group, Parabacteroides was increased, while Akkermansia was decreased. Patients who failed to achieve complete remission at interim evaluation showed marked increases in Ruminococcus and Alistipes. Extranodal involvement was associated with elevated Alistipes and Enterococcus.

Conclusions: This study identified a potential relationship between the gut microbiota and DLBCL characteristics, highlighting specific gut microbiota organisms that may influence disease development and progression.

Keywords: 16S ribosomal DNA; Akkermansia; Gut microbiota; Megamonas; Parabacteroides; diffuse large B-cell lymphoma.


Conflict of interest statement

None.

Figures

Figure 1
Figure 1
Analysis of the species of gut microbiota and comparison of β-diversity index between the two groups of patients (AA1 and AA2). A. The PCoA diagrams of β-diversity at the family level for the two groups of patients. B. The results of the permutational multivariate analysis of variance (Adonis test) and analysis of similarities test. C. The heatmap of the species composition analysis for the two groups of patients. D. The bar plots of the species composition analysis for the two groups of patients. PCoA, principal coordinate analysis; AA1, Ann Arbor stage I-II; AA2, Ann Arbor stage III-IV.
Figure 2
Figure 2
Analysis of the species of gut microbiota and comparison of α diversity index and β-diversity index between the two groups of patients (IPI-1 and IPI-2). A. α diversity index of species abundance in the IPI-1 and IPI-2 groups compared using the Wilcoxon test (P < 0.05). B. The PCoA diagram of β diversity in the IPI-1 and IPI-2 groups. C. The results of the Adonis test in the IPI-1 and IPI-2 groups. D. Genus-level ROC curve analysis. E. The heatmap of the species composition analysis for the two groups of patients. F. The bar plots of the species composition analysis for the two groups of patients. G. Differences at the genus level between the two groups of patients (IPI-1 & IPI-2). IPI, International Prognostic Index; PCoA, principal coordinate analysis; ROC, receiver operating characteristic.
Figure 3
Figure 3
Analysis of the species of gut microbiota and comparison of β-diversity index between the two groups of patients (GCB and non-GCB). A. The PCoA diagrams of β diversity between the GCB and non-GCB groups. B. The results of the Adonis test and analysis of similarities test in β-diversity index. C. Genus-level ROC curve analysis. D. The heatmap of the species composition analysis for the two groups of patients. E. The bar plots of the species composition analysis for the two groups of patients. F. The differences at the genus level between the two groups of patients. GCB, germinal center B-cell-like; PCoA, principal coordinate analysis; ROC, receiver operating characteristic.
Figure 4
Figure 4
Analysis of the species of gut microbiota and comparison of β-diversity index between the two groups of patients (HCDR and LCDR). A. The PCoA diagrams of β diversity between the two groups. B. The results of the Adonis test and analysis of similarities test in β-diversity index. C. Genus-level ROC curve analysis. D. The heatmap of the species composition analysis for the two groups of patients. E. The bar plots of the species composition analysis for the two groups of patients. F. The differences at the genus level between the two groups of patients. HCDR, high CD4+/CD8+ ratio; LCDR, low CD4+/CD8+ ratio; PCoA, principal coordinate analysis; ROC, receiver operating characteristic.
Figure 5
Figure 5
Analysis of the species of gut microbiota and comparison of β-diversity index between the two groups of patients (HB2MG and LB2MG). A. The PCoA diagrams of β diversity between the two groups. B. The results of the Adonis test and analysis of similarities test in β-diversity index. C. Genus-level ROC curve analysis. D. The heatmap of the species composition analysis for the two groups of patients. E. The bar plots of the species composition analysis for the two groups of patients. F. The differences at the genus level between the two groups of patients. HB2MG, high β2-microglobulin; LB2MG, low β2-microglobulin; PCoA, principal coordinate analysis; ROC, receiver operating characteristic.
Figure 6
Figure 6
Analysis of the species of gut microbiota and comparison of α diversity index and β-diversity index between the two groups of patients (OL-1 and OL-2). A. In the α diversity index, the Shannon index of species between the two groups according to the Wilcoxon test (P < 0.05). B. The results of the Adonis test and analysis of similarities test in β-diversity index. C. The results of the Adonis test and analysis of similarities test in β-diversity index. D. Genus-level ROC curve analysis. E. The heatmap of the species composition analysis for the two groups of patients. F. The bar plots of the species composition analysis for the two groups of patients. G. The differences at the genus level between the two groups of patients. OL-1, the no extranodal involvement group; OL-2, the extranodal involvement group; ROC, receiver operating characteristic.
Figure 7
Figure 7
Analysis of the species of gut microbiota and comparison of β-diversity index between the two groups of patients (S1 and S2). A. The PCoA diagrams of β diversity between the two groups. B. The results of the Adonis test and analysis of similarities test in β-diversity index. C. Genus-level ROC curve analysis. D. The heatmap of the species composition analysis for the two groups of patients. E. The bar plots of the species composition analysis for the two groups of patients. F. The differences at the phylum, genus and species levels between the S1 and S2 groups. S1, CR after four courses of RCHOP therapy; S2, the failure to achieve a CR after four courses of RCHOP therapy; PCoA, principal coordinate analysis; ROC, receiver operating characteristic.

Similar articles

References

    1. Ren C, Li Y, Li M, Wang Y. Unveiling vitamin C: a new hope in the treatment of diffuse large B-cell lymphoma (Review) Int J Oncol. 2025;66:40. - PMC - PubMed
    1. Shi Y, Han Y, Yang J, Liu P, He X, Zhang C, Zhou S, Zhou L, Qin Y, Song Y, Liu Y, Wang S, Jin J, Gui L, Sun Y. Clinical features and outcomes of diffuse large B-cell lymphoma based on nodal or extranodal primary sites of origin: analysis of 1,085 WHO classified cases in a single institution in China. Chin J Cancer Res. 2019;31:152–161. - PMC - PubMed
    1. Frontzek F, Lenz G. Novel insights into the pathogenesis of molecular subtypes of diffuse large B-cell lymphoma and their clinical implications. Expert Rev Clin Pharmacol. 2019;12:1059–1067. - PubMed
    1. Jelicic J, Juul-Jensen K, Bukumiric Z, Runason Simonsen M, Kragh Jørgensen RR, Roost Clausen M, Ludvigsen Al-Mashhadi A, Schou Pedersen R, Bjørn Poulsen C, Ortved Gang A, Brown P, El-Galaly TC, Stauffer Larsen T. Validation of prognostic models in elderly patients with diffuse large B-cell lymphoma in a real-world nationwide population-based study - development of a clinical nomogram. Ann Hematol. 2025;104:433–444. - PubMed
    1. Song JY, Perry AM, Herrera AF, Chen L, Skrabek P, Nasr MR, Ottesen RA, Nikowitz J, Bedell V, Murata-Collins J, Li Y, McCarthy C, Pillai R, Wang J, Wu X, Zain J, Popplewell L, Kwak LW, Nademanee AP, Niland JC, Scott DW, Gong Q, Chan WC, Weisenburger DD. Double-hit signature with TP53 abnormalities predicts poor survival in patients with germinal center type diffuse large B-cell lymphoma treated with R-CHOP. Clin Cancer Res. 2021;27:1671–1680. - PMC - PubMed

LinkOut - more resources