. 2025 Jun 9;22(11):2839-2851.
doi: 10.7150/ijms.106114. eCollection 2025.

Screening and Evaluation of tRF-Glu-CTC-013 as a Biomarker and Key Regulator in the Development of Cardiac Hypertrophy

Affiliations

Screening and Evaluation of tRF-Glu-CTC-013 as a Biomarker and Key Regulator in the Development of Cardiac Hypertrophy

Wenlin Li et al. Int J Med Sci. .

Abstract

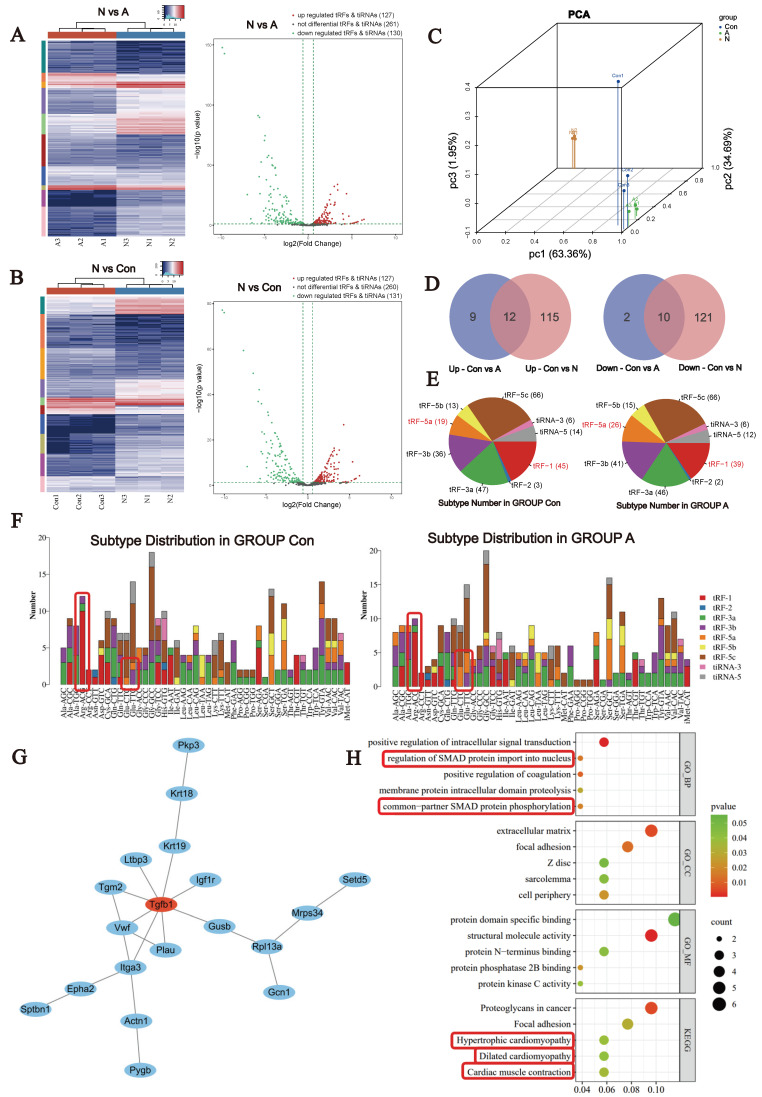
tRNA-derived small RNAs (tsRNAs) are a newly recognized class of non-coding RNAs involved in regulating RNA processing and translational control. Pathological cardiac hypertrophy, characterized by left ventricular remodeling under chronic stress, serves as a critical precursor to severe cardiovascular pathologies including myocardial ischemia, infarction, and heart failure. Utilizing an angiotensin II (Ang II)-induced mouse cardiac hypertrophy model combined with tsRNA transcriptome profiling, we identified differentially expressed tsRNAs and investigated their functional relevance. Validation in neonatal mouse ventricular myocytes (NMVMs) revealed five upregulated tsRNAs associated with hypertrophic progression. Functional characterization showed that overexpressing tRF-Glu-CTC-013 significantly reduced cardiomyocyte hypertrophy and inhibited inflammation and fibrosis. Further luciferase reporter assays revealed that tRF-Glu-CTC-013 could bind to the 3' UTR of TAS1R3, thereby inhibiting its expression and enhancing the level of autophagy in NMVMs. Taken together, these findings suggest that tsRNAs may act as novel regulators of cardiac remodeling, with tRF-Glu-CTC-013 emerging as a promising therapeutic candidate for cardioprotection via anti-hypertrophic, anti-inflammatory, and anti-fibrotic mechanisms.

Keywords: cardiac hypertrophy; tRNA-derived fragment (tRF); tRNA-derived stress-induced RNA (tiRNA); tsRNA; ventricular remodeling.


Conflict of interest statement

Competing Interests: The authors have declared that no competing interest exists.

Figures

Figure 1
Figure 1
Ang II-induced myocardial hypertrophy mouse model. (A) Representative images of hearts from the Con and Ang II groups of mice. Scale bar: 0.5 cm. (B) Heart/weight ratios and heart/tibia length ratios of Con- and Ang II-treated mice (n = 6). (C) Representative images of H&E staining, scale bar: 2 mm (n = 5). (D) Representative images of WGA staining, scale bar: 10 µm (n = 5). (E) Semiquantitative analysis of WGA staining (n = 5). (F) Semiquantitative analysis of the fibrotic area ratio based on Masson's trichrome and Sirius red staining (n = 5). Left: Masson's staining; right: Sirius red staining. (G) Representative images of Masson's trichrome and Sirius red staining, scale bar: 10 µm (n = 5). (H) q-PCR was performed to detect Nppa, Nppb and Myh7 in myocardial samples from each group. U6 was used as an internal control. ns: not significant, *P < 0.05, **P < 0.01, ***P < 0.001 vs. the control group.
Figure 2
Figure 2
Differential expression of tsRNAs in Ang II-induced myocardial hypertrophy mice. (A) Hierarchical clustering analysis and volcano plot of the differentially expressed tsRNAs in the Con and Ang II groups, n = 3. (B) Hierarchical clustering analysis and volcano plot of the differentially expressed tsRNAs in the Con and N groups, n = 3. (C) Principal component analysis. (D) Venn diagram based on the differential up- or downregulation of tsRNAs. Left: upregulated tsRNAs; Right: downregulated tsRNAs. (E) Pie chart of the distribution of tRF and tiRNA subtypes. (F) The number of tRF and tiRNA subtypes compared with that of tRNA isodecoders. (G) The most tightly clustered subnetworks were identified by the MCODE plugin, which was used to identify network gene clustering. The red nodes are the key tissue-specific genes screened. (H) Enrichment analyses of the predicted target genes.
Figure 3
Figure 3
Validation of differentially expressed tsRNAs by modeling Ang II-induced NMVMs. (A) Changes in the levels of cardiac hypertrophy markers in the NMVM model induced by different concentrations of Ang II. Units: 10-6 mol/L. (B, C) Images of the cell area labeled with Actin-Tracker Green staining and quantitative analysis of all groups (n = 5). (D-H) q-PCR was performed to detect tRF-Glu-CTC-013, tRF-Val-AAC-011, tRF-Gly-GCC-077, tRF-Leu-CAA-008, and tRF-His-GTG-023 in NMVMs from each group. (n = 5). (I) Expression of tRF-Glu-CTC-013 in the plasma of the Con and Ang II groups (n = 6). (J) The number of exon models per million mapped reads of tRF-Glu-CTC-013, tRF-Val-AAC-011, tRF-Gly-GCC-077, tRF-Leu-CAA-008, and tRF-His-GTG-023 (n = 3). U6 was used as an internal control. ns: not significant, *P < 0.05, **P < 0.01, ***P < 0.001 vs. control group.
Figure 4
Figure 4
tRF-Glu-CTC-013 counteracts myocardial hypertrophy by reducing myocardial inflammation and fibrosis. (A, B) Images of the cell area labeled with Actin-Tracker Green and quantitative analysis of the NC, Mimic, NC+Ang II, Mimic + Ang II, NCi, Inhibitor, NCi+Ang II, and Inhibitor+Ang II groups (n = 3). (C-L) q-PCR was performed to assess Nppa, Nppb, Myh7, Tnf, Il1b, Il6, Tgfb1, Col1a1, Col3a1, and Fn1 in the NMVMs from each group. U6 was used as an internal control (n = 3). ns: not significant, *P < 0.05, **P < 0.01, ***P < 0.001 vs. the control group.
Figure 5
Figure 5
tRF-Glu-CTC-013 increases autophagy in NMVMs by direct inhibition of TAS1R3. (A) Schematic representation of the tRNA from which tRF-Glu-CTC-013 is derived. (B) Human, mouse and rat sequences of tRF-Glu-CTC-013. (C) Binding site of tRF-Glu-CTC-013 in the 3'UTR of Tas1r3 predicted by the miRDB and miRanda databases. (D, E) q-PCR was performed to assess Tas1r3 in the NMVMs from each group. Gapdh was used as a loading control (n = 8). (F) The repressive effect of tRF-Glu-CTC-013 on the activity of the 3′UTR was measured by a luciferase assay (n = 4). (G, H) The expression levels of TAS1R3, phosphorylated and total mTOR, and LC3B I and II were determined by immunoblotting in NMVMs subjected to different treatments (n = 3). GAPDH was used as a loading control. (I, J) NMVMs were transfected with NC, the tRF-Glu-CTC-013 mimic, NCi, the tRF-Glu-CTC-013 inhibitor, or Tas1R3 siRNA (si-Tas1R3) for 48 h and then infected at an M.O.I. of 10 with GFP-LC3 adenovirus (GFP-LC3-Adv) and treated with Ang II for 24 h to analyze the number of autophagic vesicles (n = 5). Scale bar: 50 µm. (K, L) NMVMs were transfected with NC, the tRF-Glu-CTC-013 mimic, NCi, the tRF-Glu-CTC-013 inhibitor, or si-Tas1R3 for 48 h and then infected at an M.O.I. of 10 with tandem fluorescence-labeled LC3 adenovirus (mRFP-GFP-LC3-Adv) and treated with Ang II for 24 h to detect autophagic flux. The red spots represent the number of intracellular autolysosomes. The yellow spots indicate the number of intracellular autophagosomes (n = 5). Scale bar: 50 µm. ns, not significant; *P < 0.05, **P < 0.01, ***P < 0.001 vs. the control group.
Figure 6
Figure 6
Schematic diagram of the generation of tRF-Glu-CTC-013 and its cardioprotective effects.

Similar articles

References

    1. Perry AS, Dooley EE, Master H, Spartano NL, Brittain EL, Pettee Gabriel K. Physical Activity Over the Lifecourse and Cardiovascular Disease. Circulation research. 2023;132:1725–40. - PMC - PubMed
    1. Guo J, Huang X, Dou L, Yan M, Shen T, Tang W. et al. Aging and aging-related diseases: from molecular mechanisms to interventions and treatments. Signal Transduct Target Ther. 2022;7:391. - PMC - PubMed
    1. Xie S, Xu SC, Deng W, Tang Q. Metabolic landscape in cardiac aging: insights into molecular biology and therapeutic implications. Signal transduction and targeted therapy. 2023;8:114. - PMC - PubMed
    1. Nakamura M, Sadoshima J. Mechanisms of physiological and pathological cardiac hypertrophy. Nature reviews Cardiology. 2018;15:387–407. - PubMed
    1. Song S, Zhang X, Huang Z, Zhao Y, Lu S, Zeng L. et al. TEA domain transcription factor 1(TEAD1) induces cardiac fibroblasts cells remodeling through BRD4/Wnt4 pathway. Signal Transduct Target Ther. 2024;9:45. - PMC - PubMed

LinkOut - more resources