

Progressively diminished estrogen signaling concordant with increased fibrosis in ectopic endometrium
- PMID: 40521103
- PMCID: PMC12165729
- DOI: 10.1093/hropen/hoaf028
Progressively diminished estrogen signaling concordant with increased fibrosis in ectopic endometrium
Abstract
Study question: Do all ectopic endometrial lesions (endometriosis and adenomyosis) universally have activated estrogen signaling?
Summary answer: Estrogen signaling diminishes concordantly with increased fibrosis in ectopic endometrium, with deep endometriotic (DE) lesions exhibiting an estrogen biosynthesis capability and estrogen receptor β (ERβ) expression level comparable to that of control endometrium but having suppressed ERα.
What is known already: Endometriosis and adenomyosis are both estrogen-dependent diseases driven by estrogen-mediated lesional development, progression, and symptom manifestation. Of note, ectopic endometrium is thought to have the ability to synthesize estradiol (E2) in situ from cholesterol due to upregulation of aromatase (CYP19A1), steroidogenic acute regulatory protein (StAR), 3β-hydroxysteroid dehydrogenase type 2 (HSD3β2), and HSD17β1. In addition to increased estrogen biosynthesis, ERβ and G-protein coupled ER (GPER) are also overexpressed in ectopic endometrium. In particular, the prevailing view holds that prostaglandin E2 plays a vital role in facilitating estrogen biosynthesis and the upregulation of ERβ, positioning itself in the central nexus in a feed-forward loop linking hyperestrogenism and inflammation in all ectopic endometria.
Study design size duration: After obtaining written informed consent, we collected lesional tissues from 19 patients with ovarian endometriosis (OE) and 20 patients each with adenomyosis (AD) and DE. As controls, normal endometrial tissue samples (CT) were procured from 20 cycling women free of endometriosis and adenomyosis, and age- and menstrual phase-matched with patients in the other groups. Additionally, primary ectopic or control endometrial stromal cells derived from eight subjects in each of the OE, AD, DE, and CT groups were cultured for experiments.
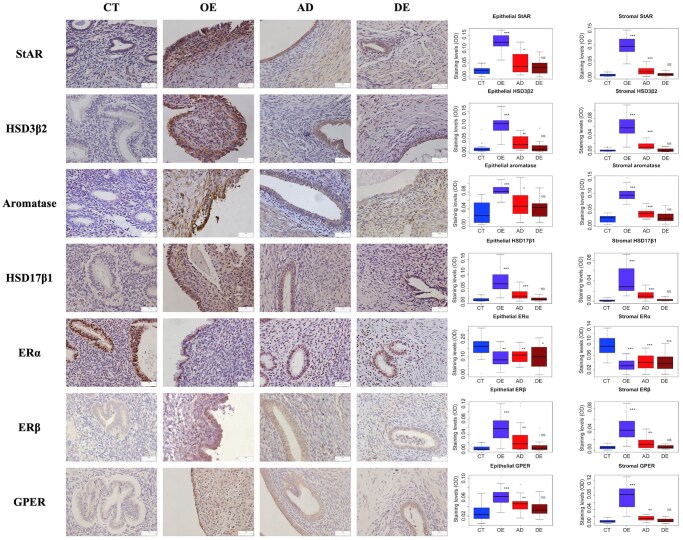
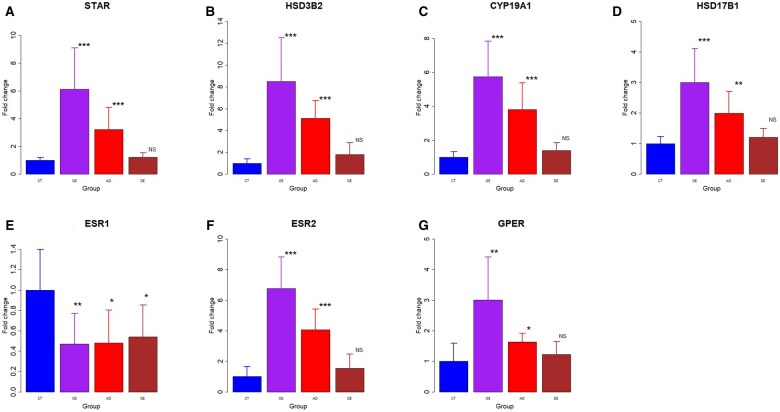
Participants/materials setting methods: We performed immunohistochemistry and western blotting to assess the expression of proteins key to the estrogen biosynthesis (StAR, HSD3β2, aromatase, and HSD17β1) and estrogen receptors (ERα, ERβ, and GPER). Fibrosis was quantified via Masson trichrome staining. Real-time RT-PCR was performed to assess corresponding gene expression levels. The estrogen concentrations in cell cultures of primary stromal cells derived from different tissues were also measured by ELISA.
Main results and the role of chance: Among all ectopic endometrial tissue samples, the extent of lesional fibrosis was the highest in the DE lesions, followed by the AD and then the OE lesions. The protein and gene expression levels of StAR, HSD3β2, aromatase, and HSD17β1, the four proteins critically involved in estrogen biosynthesis, were significantly higher than in the CT group in OE and AD lesions, but were lowest in DE lesions, which were comparable to that of control endometrium. There was a significantly negative correlation between the expression of these proteins and the extent of lesional fibrosis. Consistently, while the concentration of estrogen in culture supernatants from OE cells was significantly higher than those in CT, it was significantly reduced in AD and DE lesions. In fact, the estrogen concentration in DE cell supernatants was comparable with that in the CT group. The expression of ERβ and GPER was significantly higher in OE and AD lesions than in the CT group and progressively declined with increasing lesional fibrosis; in the DE group, their expression was comparable to the CT group. A significant negative correlation was observed between their expression and the extent of lesional fibrosis. No significant difference in ERα expression was found among different types of ectopic endometrium, but all showed significantly and uniformly lower expression than that of the CT endometrium.
Limitations reasons for caution: While diminished estrogen signaling concordant with increased lesional fibrosis was demonstrated, no mechanistic data were provided. In addition, while in this study several genes/proteins known to be key to estrogen signaling were evaluated, some other genes/proteins that are also involved in estrogen signaling, such as other members of the HSD17B family, were not evaluated.
Wider implications of the findings: Our findings challenge the prevailing notion of activated in situ estrogen signaling in ectopic endometrium of all kinds via the feed-forward loop. As such, there is a need to re-appraise our treatment strategies, especially for lesions that are highly fibrotic and thus well advanced. In addition, our findings can be capitalized to help choose the best treatment modality and to inspire novel therapeutics for endometriosis and adenomyosis.
Study funding/competing interests: This research was supported in part by grant 82071623 (S.-W.G.) from the National Natural Science Foundation of China and by grant 202440057 (J.N.) from the Clinical Research Project of Shanghai Municipal Health Commission. S.-W.G. is a member of the Scientific Advisory Board of Heranova, BioSciences and of FimmCyte A.G., and has provided consultancy advice to these companies, as well as to Shanghai Huilun Biotechnology, but these activities had no bearing on this work. The other authors have no conflict of interest.
Trial registration number: N/A.
Keywords: adenomyosis; ectopic endometrium; endometriosis; estrogen receptor; estrogen signaling; fibrosis.
© The Author(s) 2025. Published by Oxford University Press on behalf of European Society of Human Reproduction and Embryology.
Conflict of interest statement
S.-W.G. is a member of the Scientific Advisory Board of Heranova, BioSciences and of FimmCyte A.G., and has provided consultancy advice to these companies, as well as to Shanghai Huilun Biotechnology, but these activities had no bearing on this work. The other authors have no conflict of interest.
Figures


Similar articles
-
Progressively Diminished Prostaglandin E2 Signaling in Concordance with Increasing Fibrosis in Ectopic Endometrium.Reprod Sci. 2025 Apr;32(4):1271-1286. doi: 10.1007/s43032-024-01658-w. Epub 2024 Aug 22. Reprod Sci. 2025. PMID: 39174854
-
Corroborating evidence for platelet-induced epithelial-mesenchymal transition and fibroblast-to-myofibroblast transdifferentiation in the development of adenomyosis.Hum Reprod. 2016 Apr;31(4):734-49. doi: 10.1093/humrep/dew018. Epub 2016 Feb 22. Hum Reprod. 2016. PMID: 26908845
-
Peroxisome proliferator-activated receptor-γ coactivator 1α-mediated pathway as a possible therapeutic target in endometriosis.Hum Reprod. 2019 Jun 4;34(6):1019-1029. doi: 10.1093/humrep/dez067. Hum Reprod. 2019. PMID: 31119261
-
Hormone receptor profile of ectopic and eutopic endometrium in adenomyosis: a systematic review.Hum Reprod Open. 2025 Jan 20;2025(1):hoaf002. doi: 10.1093/hropen/hoaf002. eCollection 2025. Hum Reprod Open. 2025. PMID: 39935764 Free PMC article.
-
Adenomyosis pathogenesis: insights from next-generation sequencing.Hum Reprod Update. 2021 Oct 18;27(6):1086-1097. doi: 10.1093/humupd/dmab017. Hum Reprod Update. 2021. PMID: 34131719 Free PMC article. Review.
References
-
- Attar E, Tokunaga H, Imir G, Yilmaz MB, Redwine D, Putman M, Gurates B, Attar R, Yaegashi N, Hales DB et al. Prostaglandin E2 via steroidogenic factor-1 coordinately regulates transcription of steroidogenic genes necessary for estrogen synthesis in endometriosis. J Clin Endocrinol Metab 2009;94:623–631. - PMC - PubMed
-
- Barbieri RL. Hormone treatment of endometriosis: the estrogen threshold hypothesis. Am J Obstet Gynecol 1992;166:740–745. - PubMed
-
- Brandenberger AW, Lebovic DI, Tee MK, Ryan IP, Tseng JF, Jaffe RB, Taylor RN. Oestrogen receptor (ER)-alpha and ER-beta isoforms in normal endometrial and endometriosis-derived stromal cells. Mol Hum Reprod 1999;5:651–655. - PubMed
-
- Brosens IA. Endometriosis—a disease because it is characterized by bleeding. Am J Obstet Gynecol 1997;176:263–267. - PubMed
LinkOut - more resources
Full Text Sources
Medical
Research Materials