. 2025 May 25;15(13):6290-6312.
doi: 10.7150/thno.109513. eCollection 2025.

KLK8/HGF/Met signaling pathway mediates diabetes-associated hippocampal neuroinflammation in male mice

Affiliations

KLK8/HGF/Met signaling pathway mediates diabetes-associated hippocampal neuroinflammation in male mice

Dan-Hong Xu et al. Theranostics. .

Abstract

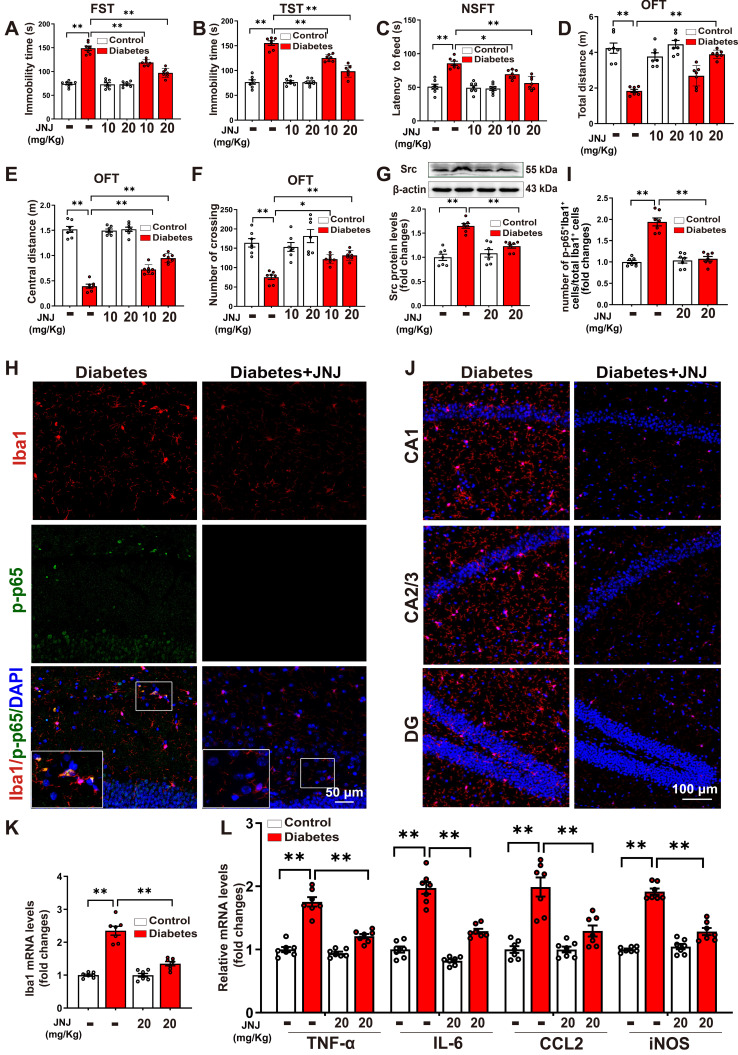
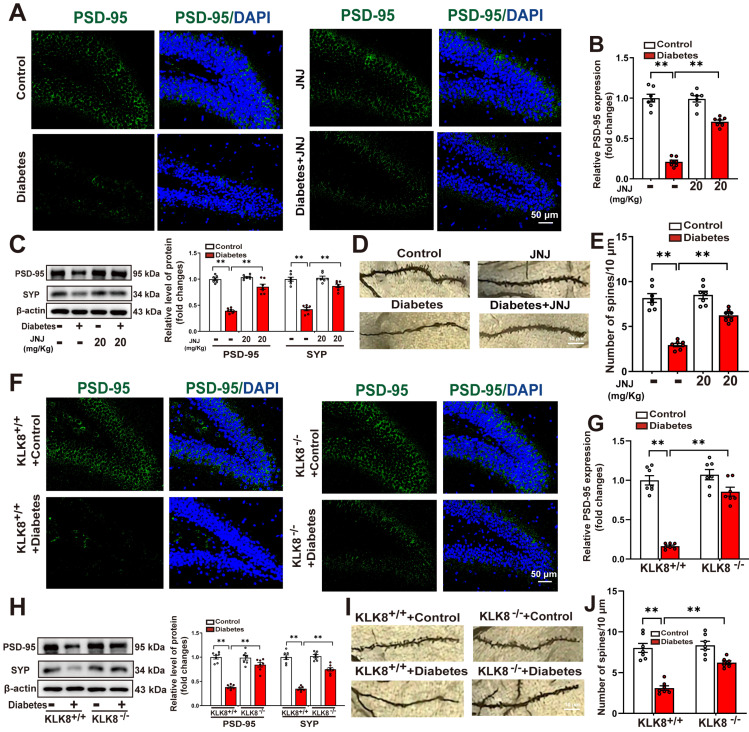
Rationale: Neuroinflammation plays a critical role in the pathogenesis of diabetes-associated depression. Tissue kallikrein-related peptidase 8 (KLK8), a secreted serine protease, has been implicated in the pathogenesis of depression- and anxiety-related behaviors across various etiologies, however the underlying mechanisms remain largely unexplored. This study elucidates a novel mechanism by which KLK8 upregulation contributes to diabetes-induced microglial activation and neuroinflammation in the hippocampus through modulating the hepatocyte growth factor (HGF)/Met signaling pathway. Methods and Results: Streptozotocin (STZ)-induced diabetic mice exhibited increased KLK8 expression in the hippocampus, an effect that was mitigated in KLK8-deficient or aerobic running-exercised mice. KLK8 deficiency significantly reduced depression-like behaviors, microglial activation, and neuroinflammation in diabetic mice. In BV2 mouse microglial cells, adenovirus-mediated overexpression of KLK8 (Ad-KLK8) was sufficient to induce microglial activation. Co-immunoprecipitation (Co-IP) coupled with mass spectrometry revealed that CD44 might interact with KLK8. KLK8 overexpression decreased CD44 levels in microglial cells. However, the CD44 activator Angstrom6 further exacerbated KLK8-induced microglial activation. Conversely, transcriptional profiling of KLK8-overexpressing microglial cells and subsequent validation demonstrated that the Met/Src/Btk/NF-κB signaling pathway played a central role in mediating the stimulatory effects of KLK8 on microglial activation in both Ad-KLK8-treated BV2 cells and human microglial cell line HMC3 cells stably transfected with KLK8 lentivirus (Lv-KLK8). The Met receptor is activated upon binding to its ligand HGF, which exists as an inactive precursor (pro-HGF). Our findings showed that KLK8 cleaved pro-HGF, promoting HGF release and subsequently activating the Met/Src/Btk/NF-κB signaling pathway in microglial cells. High glucose conditions increased KLK8 expression and enhanced HGF release, thereby stimulating the Met/Src/Btk/NF-κB signaling pathway and microglial activation in a KLK8-dependent manner. Systemic administration of a Met inhibitor inactivated the Met/Src/Btk/NF-κB pathway, reducing depression-like behaviors, microglial activation, and neuroinflammation in STZ-induced diabetic mice. Both Met inhibitor and KLK8 deficiency enhanced hippocampal neuroplasticity in STZ-induced diabetic mice. Finally, we demonstrated that running exercise reversed KLK8 upregulation and inactivated Met/Src/Btk/NF-κB signaling pathways, thereby attenuating neuroinflammation, improving neuroplasticity, and alleviating depression-like behaviors in STZ-induced diabetic mice. Conclusions: This study provides evidence that the KLK8/HGF/Met signaling pathway mediates diabetes-associated hippocampal neuroinflammation and depression-like behaviors, highlighting the therapeutic potential of targeting this pathway in diabetes-associated depression.

Keywords: aerobic exercise; depression; diabetes; hepatocyte growth factor; microglia activation; neuroinflammation; tissue kallikrein-related peptidase 8.


Conflict of interest statement

Competing Interests: The authors have declared that no competing interest exists.

Figures

Figure 1
Figure 1
KLK8 deficiency mitigates depressive-like behaviors, microglia activation, and neuroinflammation in STZ-induced diabetic mice. A, Published GEO dataset GSE34451 was analyzed for hippocampal KLK8 expression in STZ-induced diabetic rats (n = 3, unpaired t-test, p = 0.008). B, The levels of KLK8 mRNA and protein were measured in the hippocampus after 5 weeks of STZ-induced diabetes by qRT-PCR (n = 7, unpaired t-test, p < 0.001) and western blotting (n = 7, unpaired t-test, p < 0.001), respectively. Representative protein bands were presented on the top of the histograms. C-H, Depressive behavioral tests were performed in wild-type and KLK8-/- mice after 5 weeks of STZ-induced diabetes. C, The immobility time in the FST (n = 7, two-way ANOVA, F1,24 (genotype) = 5.006, p = 0.035; F1,24 (treatment) = 24.253, p < 0.001; F1,24 (genotype×treatment) = 4.039, p = 0.056). D, The immobility time in the TST (n = 7, two-way ANOVA, F1,24 (genotype) = 16.824, p < 0.001; F1,24 (treatment) = 29.507, p < 0.001; F1,24 (genotype×treatment) = 14.443, p < 0.001). E, The latency to feed in the NSFT (n = 7, two-way ANOVA, F1,24 (genotype) = 10.934, p = 0.003; F1,24 (treatment) = 28.872, p < 0.001; F1,24 (genotype×treatment) = 10.129, p = 0.004). F, Total distance in the OFT (n = 7, two-way ANOVA, F1,24 (genotype) = 4.171, p = 0.052; F1,24 (treatment) = 35.471, p < 0.001;F1,24 (genotype×treatment) = 7.207, p = 0.013). G, Central distance in the OFT (n = 7, two-way ANOVA, F1,24 (genotype) = 9.261, p = 0.006; F1,24 (treatment) = 438.822, p < 0.001;F1,24 (genotype×treatment) = 14.077, p < 0.001). H, Number of crossing squares in the OFT (n = 7, two-way ANOVA, F1,24 (genotype) = 6.572, p = 0.017; F1,24 (treatment) = 65.507, p < 0.001; F1,24 (genotype×treatment) = 10.818, p = 0.003). I, Immunofluorescent staining showed Iba1 (red) expression in the CA1, CA2/3, and DG subregions of the hippocampus in wild-type and KLK8-/- mice after 5 weeks of STZ-induced diabetes. Nuclei were counterstained with DAPI (blue). Scale bar = 100 μm. The quantifications of Iba1+ cell numbers in each subfield of the hippocampus were presented in the right panels (n = 7, two-way ANOVA, CA1: F1,24 (genotype) = 21.571, p < 0.001; F1,24 (treatment) = 22.334, p < 0.001; F1,24 (genotype×treatment) = 13.913, p = 0.001. CA2/3: F1,24 (genotype) = 39.5, p < 0.001; F1,24 (treatment) = 27.288, p < 0.001; F1,24 (genotype×treatment) = 22.219, p < 0.001. DG: F1,24 (genotype) = 51.154, p < 0.001; F1,24 (treatment) = 70.554, p < 0.001; F1,24 (genotype×treatment) = 46.632, p < 0.001). J, The mRNA expression levels of Iba1 in the hippocampus of wild-type and KLK8-/- mice after 5 weeks of STZ-induced diabetes were detected by qRT-PCR (n = 7, two-way ANOVA, F1,24 (genotype) = 65.845, p < 0.001; F1,24 (treatment) = 141.79, p < 0.001; F1,24 (genotype×treatment) = 72.842, p < 0.001). K, The mRNA expression levels of TNF-α, IL-6, CCL2, and iNOS in the hippocampus of wild-type and KLK8-/- mice after 5 weeks of STZ-induced diabetes were detected by qRT-PCR (n = 7, two-way ANOVA, TNF-α: F1,24 (genotype) = 50.468, p < 0.001; F1,24 (treatment) = 66.765, p < 0.001; F1,24 (genotype×treatment) = 13.231, p = 0.001. IL-6: F1,24 (genotype) = 30.734, p < 0.001; F1,24 (treatment) = 69.409, p < 0.001; F1,24 (genotype×treatment) = 25.936, p < 0.001. CCL2: F1,24 (genotype) = 65.209, p < 0.001; F1,24 (treatment) = 90.244, p < 0.001; F1,24 (genotype×treatment) = 48.218, p < 0.001. iNOS: F1,24 (genotype) = 19.097, p < 0.001; F1,24 (treatment) = 36.559, p < 0.001; F1,24 (genotype×treatment) = 17.733, p < 0.001). Data were presented as means ± SEM. * p < 0.05, ** p < 0.01.
Figure 2
Figure 2
KLK8 promotes microglial activation via a Met-dependent signaling pathway. A-B, BV2 mouse microglial cells were infected with Ad-KLK8 at a MOI of 1, 3, or 10 for 48 h. A, mRNA and protein expression levels of Iba1 were detected by qRT-PCR (F3,12 = 167.971, p < 0.001) and western blotting (F3,12 = 124.428, p < 0.001), respectively. Representative protein bands were presented on the left of the histograms. B, The mRNA expression levels of TNF-α, IL-6, CCL2, and iNOS were detected by qRT-PCR (TNF-α: F3,12 = 225.322, p < 0.001. IL-6: F3,12 = 23.992, p < 0.001. CCL2: F3,12 = 59.73, p < 0.001. iNOS: F3,12 = 127.568, p < 0.001). C-E, BV2 cells were infected with Ad-Vector or Ad-KLK8 at a MOI of 3 for 48 h. Dysregulated genes were analyzed by RNA-seq. C, Volcano plots showing DEGs in Ad-KLK8-treated BV2 cells. Red reflects upregulated and blue indicates downregulated genes. D, Heat map of DEGs, red indicates upregulated and blue shows downregulated genes. E, GSEA was then performed to determine the enriched signaling pathways in KLK8-overexpressed BV2 cells. GSEA gene sets associated with Met-activates-PTK2 (top) and Met-promotes-cell-motility (bottom) signaling pathways were significantly enriched in the Ad-KLK8-treated BV2 cells. Heat maps of the dysregulated target genes of Met-activates-PTK2 and Met-promotes-cell-motility (bottom) signaling pathways in Ad-KLK8 treated BV2 were presented on the right of the GSEA plots. Red reflects upregulated and blue indicates downregulated genes. F-G, BV2 cells were infected with Ad-KLK8 at a MOI of 3 for 48 h in the presence or absence of the Met inhibitor JNJ-38877605 at the indicated concentrations. H-I, A stably KLK8-overexpressing HMC3 cell line was generated through infection with Lv-KLK8. Cells infected with an empty lentivirus served as the control group (Lv-Vector). Stably KLK8-overexpressing HMC3 cells and control cells were treated with or without the Met inhibitor JNJ-38877605 at the indicated concentrations for 48 h. Protein levels of p-Met, Met, p-Btk, Btk, p-p65, p65, Src, and Iba1 in BV2 cells (F) or HMC3 cells (H) were determined by western blot analysis. The mRNA expression levels of Iba1, TNF-α, IL-6, CCL2, and iNOS in BV2 cells (G, Iba1: F5,18 = 68.758, p < 0.001. TNF-α: F5,18 = 43.501, p < 0.001. IL-6: F5,18 = 259.947, p < 0.001. CCL2: F5,18 = 61.644, p < 0.001. iNOS: F5,18 = 111.889, p < 0.001) or HMC3 cells (I, Iba1: F5,18 = 23.051, p < 0.001. TNF-α: F5,18 = 17.202, p < 0.001. IL-6: F5,18 = 61.04, p < 0.001. CCL2: F5,18 = 12.358, p < 0.001. iNOS: F5,18 = 19.215, p < 0.001) were detected by qRT-PCR. Data were presented as means ± SEM (n = 4, one-way ANOVA). * p < 0.05, ** p < 0.01. JNJ represents JNJ-38877605.
Figure 3
Figure 3
KLK8 cleaves pro-HGF and augments HGF release, thereby facilitating Met signaling and microglial activation. A, BV2 cells were infected with Ad-KLK8 at a MOI of 3 for 48 h with or without anti-KLK8 neutralizing antibody (2.5 μg/mL). HGF contents in the cell medium were measured by ELISA assay (F3,12 = 16.994, p < 0.001). B, BV2 cells were infected with Ad-KLK8 at a MOI of 3 for 48 h with or without serine protease inhibitors ZnSO4 (0.05 mM) and antipain (0.05 mM), respectively (left, F5,18 = 39.434, p < 0.001). A stably KLK8-overexpressing HMC3 cell line was generated through infection with Lv-KLK8. Cells infected with an empty lentivirus served as the Lv-Vector. Stably KLK8-overexpressing HMC3 cells and control cells were treated with or without serine protease inhibitors ZnSO4 (0.05 mM) and antipain (0.05 mM), respectively (right, F5,18 = 14.914, p < 0.001). HGF contents in the cell medium were measured by ELISA assay. C, Purified recombinant human pro-HGF (rhpro-HGF) was incubated with or without activated recombinant human KLK8 (rhKLK8) at the indicated concentrations, and analyzed by western blot using a pro-HGF antibody. D-E, A stably KLK8-overexpressing HMC3 cell line was generated through infection with Lv-KLK8. Cells infected with an empty lentivirus served as the Lv-Vector. Stably KLK8-overexpressing HMC3 cells and control cells were treated with or without a fully human anti-HGF neutralizing antibody Rilotumumab at the indicated concentrations. D, Protein levels of p-Met, Met, p-Btk, Btk, p-p65, p65, Src, and Iba1 were determined by western blot analysis. Representative protein bands were presented on the left of the histograms (p-Met/Met: F3,12 = 50.48, p < 0.001. p-Btk/Btk: F3,12 = 90.277, p < 0.001. p-p65/p65: F3,12 = 89.791, p < 0.001. Src/β-actin: F3,12 = 555.454, p < 0.001. Iba1/β-actin: F3,12 = 141.437, p < 0.001). E, The mRNA levels of Iba1, TNF-α, IL-6, CCL2, and iNOS were detected by qRT-PCR (Iba1: F5,18 = 44.23, p < 0.001. TNF-α: F5,18 = 52.255, p < 0.001. IL-6: F5,18 = 99.978, p < 0.001. CCL2: F5,18 = 41.607, p < 0.001. iNOS: F5,18 = 77.973, p < 0.001). F, Schematic diagram of the mechanism underlying KLK8-induced microglial activation. KLK8 cleaves pro-HGF and augments HGF release, leading to the activation of the Met/Src/BTK/NF-κB signaling pathway and subsequent microglial activation. Data were presented as means ± SEM (n = 4, one-way ANOVA). * p < 0.05, ** p < 0.01.
Figure 4
Figure 4
High glucose enhances the release of HGF, thereby stimulating Met signaling and microglial activation via a mechanism dependent on KLK8. A, Two published scRNA-seq datasets were analyzed for KLK8 mRNA expression in microglial cells from the hippocampus of db/db mice (GSE201644) and whole brain of high-fat diet-treated mice (GSE217045). B, BV2 cells were treated with increasing concentration of glucose (15 and 25 mM) for 48 h. The mRNA and protein expression levels of KLK8 were examined by qRT-PCR (F2,9 = 45.421, p < 0.001) and western blotting (F2,9 = 23.053, p < 0.001), respectively. Representative protein bands were presented on the top of the histograms. C-F, BV2 cells were transfected with control siRNA or KLK8 siRNAs, and then treated with normal glucose (NG, 5.5 mM D-glucose) or high glucose (HG, 25 mM D-glucose) for 48 h. G-I, BV2 cells were treated with NG or HG with or without JNJ-38877605 at the indicated concentrations for 48 h. C and H, The mRNA and protein levels of Iba1 were examined by qRT-PCR(C, F3,12 = 106.815, p < 0.001; H, F3,12 = 78.039, p < 0.001) and western blotting (C,F3,12 = 121.672, p < 0.001; H, F3,12 = 74.815, p < 0.001), respectively. Representative protein bands were presented on the top of the histograms. D and I, The mRNA levels of TNF-α, IL-6, CCL2, and iNOS were detected by qRT-PCR (D, TNF-α: F3,12 = 62.381, p < 0.001. IL-6: F3,12 = 78.392, p < 0.001. CCL2: F3,12 = 88.773, p < 0.001. iNOS: F3,12 = 87.725, p < 0.001; I, TNF-α: F3,12 = 81.468, p < 0.001. IL-6: F3,12 = 96.25, p < 0.001. CCL2: F3,12 = 71.734, p < 0.001. iNOS: F3,12 = 93.927, p < 0.001). E, HGF contents in the cell medium were measured by ELISA assay (F3,12 = 17.209, p < 0.001). F and G, The protein levels of p-Met, Met, p-Btk, Btk, p-p65, p65 and Src were determined by western blot analysis. J, Schematic diagram of the mechanism underlying high glucose-induced microglial activation. Exposure to high glucose results in the upregulation of KLK8, which subsequently enhances HGF release in microglial cells, leading to the activation of the Met/Src/BTK/NF-κB signaling pathway and subsequent microglial activation. Data were presented as means ± SEM (n = 4, one-way ANOVA). ** p < 0.01. JNJ represents JNJ-38877605.
Figure 5
Figure 5
Met inhibitor inactivates Src/Btk/NF-κB signaling pathways and attenuates depressive-like behaviors, microglia activation, and neuroinflammation in STZ-induced diabetic mice. Control or STZ-induced diabetic mice were intraperitoneally injected with the Met inhibitor JNJ-38877605 at the indicated concentrations once every two days for a period of 5 weeks. A-F, Depressive behavioral tests were performed in diabetic mice injected with or without JNJ-38877605. A, The immobility time in the FST (F2,36 (Met inhibitor) = 33.722, p < 0.001; F1,36 (treatment) = 338.557, p < 0.001; F2,36 (Met inhibitor×treatment) = 31.517, p < 0.001). B, The immobility time in the TST (F2,36 (Met inhibitor) = 30.134, p < 0.001; F1,36 (treatment) = 274.868, p < 0.001; F2,36 (Met inhibitor×treatment) = 29.59, p < 0.001). C, The latency to feed in the NSFT (F2,36 (Met inhibitor) = 13.162, p < 0.001; F1,36 (treatment) = 67.763, p < 0.001; F2,36 (Met inhibitor×treatment) = 9.069, p < 0.001). D, Total distance in the OFT (F2,36 (Met inhibitor) = 18.756, p < 0.001; F1,36 (treatment) = 69.048, p < 0.001; F2,36 (Met inhibitor×treatment) = 11.387, p < 0.001). E, Central distance in the OFT (F2,36 (Met inhibitor) = 21.682, p < 0.001; F1,36 (treatment) = 564.581, p < 0.001; F2,36 (Met inhibitor×treatment) = 21.773, p < 0.001). F, Number of crossing squares in the OFT (F2,36 (Met inhibitor) = 6.708, p < 0.001; F1,36 (treatment) = 47.193, p < 0.001; F2,36 (Met inhibitor×treatment) = 4.162, p < 0.001). G, The protein levels of Src were examined by western blotting in hippocampal tissue. Representative protein bands were presented on the top of the histograms (F1,24 (Met inhibitor) = 8.067, p < 0.001; F1,24 (treatment) = 44.705, p < 0.001; F1,24 (Met inhibitor×treatment) = 17.681, p < 0.001). H, Hippocampal sections were stained with fluorophore-labeled antibodies against the microglial cell marker Iba1 (red) and phosphorylated p65 (p-p65, green). DAPI staining was used to detect nuclei (blue). The merge image represents double positive staining for Iba1 and p-p65. Areas in white boxes were shown enlarged. Scale bar = 50 μm. I, The quantification of the percentage of Iba1+/p-p65+ cells in total Iba1+ cells (F1,24 (Met inhibitor) = 41.553, p < 0.001; F1,24 (treatment) = 57.86, p < 0.001; F1,24 (Met inhibitor×treatment) =48.965, p < 0.001). J, Immunofluorescent staining showed Iba1 (red) expression in the CA1, CA2/3, and DG subregions of the hippocampus. Nuclei were counterstained with DAPI (blue). Scale bar = 100 μm. K, The mRNA levels of Iba1 in the hippocampus were detected by qRT-PCR (F1,24 (Met inhibitor) = 39.264, p < 0.001; F1,24 (treatment) = 112.522, p < 0.001; F1,24 (Met inhibitor×treatment) =38.966, p < 0.001). L, The mRNA levels of TNF-α, IL-6, CCL2, and iNOS in the hippocampus were detected by qRT-PCR (TNF-α: F1,24 (Met inhibitor) = 40.845, p < 0.001; F1,24 (treatment) = 118.166, p < 0.001; F1,24 (Met inhibitor) = 26.897, p < 0.001. IL-6: F1,24 (Met inhibitor) =57.168, p < 0.001; F1,24 (treatment) = 159.94, p < 0.001; F1,24 (Met inhibitor×treatment) = 19.772, p < 0.001. CCL2: F1,24 (Met inhibitor) = 13.547, p = 0.001; F1,24 (treatment) = 46.115, p < 0.001; F1,24 (Met inhibitor×treatment) = 13.512, p = 0.001. iNOS: F1,24 (Met inhibitor) = 44.11, p < 0.001; F1,24 (treatment) = 171.468, p < 0.001; F1,24 (Met inhibitor×treatment) = 58.915, p < 0.001). Data were presented as means ± SEM (n = 7, two-way ANOVA). ** p < 0.01. JNJ represents JNJ-38877605.
Figure 6
Figure 6
Effects of Met inhibitor or KLK8 deficiency on hippocampal neuroplasticity in STZ-induced diabetic mice. Control or STZ-induced diabetic mice were subjected to moderate intensity treadmill training for 5 weeks. A and F, Hippocampal sections were stained with fluorophore-labeled antibodies against PSD-95 (green). DAPI staining was used to detect nuclei (blue). Scale bar = 50 μm. B and G, The quantification of the fluorescence intensity of PSD-95 (B, F1,24 (Met inhibitor) = 50.246, p < 0.001; F1,24 (treatment) = 243.038, p < 0.001; F1,24 (Met inhibitor×treatment) =54.295 , p < 0.001. G, F1,24 (genotype) = 52.468, p < 0.001; F1,24 (treatment) = 99.466, p < 0.001; F1,24 (genotype×treatment) = 34.622, p < 0.001). C and H, protein expression levels of PSD-95 (C, F1,24 (Met inhibitor) = 31.067, p < 0.001; F1,24 (treatment) = 89.132, p < 0.001; F1,24 (Met inhibitor×treatment) = 34.285, p < 0.001. H , F1,24 (genotype) = 67.412, p < 0.001; F1,24 (treatment) = 169.259, p < 0.001; F1,24 (genotype×treatment) = 48.346, p < 0.001) and SYP (C, F1,24 (Met inhibitor) = 37.682, p < 0.001; F1,24 (treatment) = 180.341, p < 0.001; F1,24 (Met inhibitor×treatment) = 30.558, p < 0.001. H, F1,24 (genotype) = 49.441, p < 0.001; F1,24 (treatment) = 119.223, p < 0.001; F1,24 (genotype×treatment) = 39.381, p < 0.001) were detected by western blotting. Representative protein bands were presented on the left of the histograms. D and I, Representative microphotograph of Golgi-Cox staining in the hippocampal sections. Scale bar = 10 μm. E and J, Quantification of dendritic spine density of neurons in the hippocampus (E, F1,24 (Met inhibitor) = 25.859, p < 0.001; F1,24 (treatment) = 109.214, p < 0.001; F1,24 (Met inhibitor×treatment) = 17.078, p < 0.001. J, F1,24 (genotype) = 20.743, p < 0.001; F1,24 (treatment) = 73.995, p < 0.001; F1,24 (genotype×treatment) = 11.577, p = 0.002) . Data were presented as means ± SEM (n = 7, two-way ANOVA). ** p < 0.01. JNJ represents JNJ-38877605.
Figure 7
Figure 7
Running exercise reverses KLK8 upregulation and inactivates Met/Src/Btk/NF-κB signaling pathways, thereby attenuating microglia activation and neuroinflammation in the hippocampus of STZ-induced diabetic mice. Control or STZ-induced diabetic mice were subjected to moderate intensity treadmill training for 5 weeks. A, The levels of KLK8 mRNA and protein were measured in the hippocampus of the STZ-induced diabetic mice subjected to sedentary conditions or running exercise by qRT-PCR (F1,24 (running exercise) = 57.427, p < 0.001; F1,24 (treatment) = 74.348, p < 0.001; F1,24 (running exercise×treatment) = 37.177, p < 0.001) and western blotting F1,24 (running exercise) = 157.255, p < 0.001; F1,24 (treatment) = 195.184, p < 0.001; F1,24 (running exercise×treatment) = 78.996, p < 0.001), respectively. Representative protein bands were presented on the top of the histograms. B, Hippocampal sections were stained with fluorophore-labeled antibodies against phosphorylated Met (p-Met, red). DAPI staining was used to detect nuclei (blue). Scale bar = 50 μm. C, Hippocampal sections were stained with fluorophore-labeled antibodies against phosphorylated Btk (p-Btk, red). DAPI staining was used to detect nuclei (blue). Scale bar = 50 μm. D, Hippocampal sections were stained with fluorophore-labeled antibodies against the microglial cell marker Iba1 (red) and p-p65 (green). DAPI staining was used to detect nuclei (blue). The merge image represents double positive staining for Iba1 and p-p65. Areas in white boxes were shown enlarged. Scale bar = 50 μm. E, Immunofluorescent staining showed Iba1 (red) expression in the CA1, CA2/3, and DG subregions of the hippocampus. Nuclei were counterstained with DAPI (blue). Scale bar = 100 μm. The quantification of Iba1+ cell numbers in each subfield of the hippocampus were presented in the right panels (CA1: F1,24 (running exercise) = 30.348, p < 0.001; F1,24 (treatment) = 37.189, p < 0.001; F1,24 (running exercise×treatment) = 26.515, p < 0.001. CA2/3: F1,24 (running exercise) = 17.621, p < 0.001; F1,24 (treatment) = 32.211, p < 0.001; F1,24 (running exercise×treatment) = 15.279, p < 0.001. DG: F1,24 (running exercise) = 33.171, p < 0.001; F1,24 (treatment) = 32.722, p < 0.001; F1,24 (running exercise×treatment) = 17.916, p < 0.001). F, The mRNA expression levels of Iba1 in the hippocampus were detected by qRT-PCR (F1,24 (running exercise) = 9.947, p = 0.004; F1,24 (treatment) = 15.644, p < 0.001; F1,24 (running exercise×treatment) = 8.656, p < 0.007). G, The mRNA expression levels of TNF-α, IL-6, CCL2, and iNOS in the hippocampus were detected by qRT-PCR (TNF-α: F1,24 (running exercise) = 85.403, p < 0.001; F1,24 (treatment) = 28.816, p < 0.001; F1,24 (running exercise×treatment) = 36.099, p < 0.001. IL-6: F1,24 (running exercise) =17.182, p < 0.001; F1,24 (treatment) = 33.374, p < 0.001; F1,24 (running exercise×treatment) = 14.296, p < 0.001. CCL2: F1,24 (running exercise) = 24.974, p < 0.001; F1,24 (treatment) = 10.641, p = 0.003; F1,24 (running exercise×treatment) = 8.261, p = 0.008. iNOS: F1,24 (running exercise) = 71.497, p < 0.001; F1,24 (treatment) = 15.102, p < 0.001; F1,24 (running exercise×treatment) = 27.053, p < 0.001). Data were presented as means ± SEM (n = 7, two-way ANOVA). ** p < 0.01.
Figure 8
Figure 8
Running exercise improves hippocampal neuroplasticity and alleviates depression-like behaviors in STZ-induced diabetic mice. Control or STZ-induced diabetic mice were subjected to moderate intensity treadmill training for 5 weeks. A, Hippocampal sections were stained with fluorophore-labeled antibodies against PSD-95 (green). DAPI staining was used to detect nuclei (blue). Scale bar = 50 μm. B, The quantification of the fluorescence intensity of PSD-95 (F1,24 (running exercise) = 73.555, p < 0.001; F1,24 (treatment) = 253.885, p < 0.001; F1,24 (running exercise×treatment) = 47.885, p < 0.001). C, protein expression levels of PSD-95 (F1,24 (running exercise) = 140.206, p < 0.001; F1,24 (treatment) = 327.622, p < 0.001; F1,24 (running exercise×treatment) = 136.337, p < 0.001) and SYP (F1,24 (running exercise) = 19.705, p < 0.001; F1,24 (treatment) = 133.349, p < 0.001; F1,24 (running exercise×treatment) = 14.086, p < 0.001) were detected by western blotting. Representative protein bands were presented on the left of the histograms. D, Representative microphotograph of Golgi-Cox staining in the hippocampal sections. Scale bar = 10 μm. E, Quantification of dendritic spine density of neurons in the hippocampus (F1,24 (running exercise) = 15.754, p < 0.001; F1,24 (treatment) = 51.924, p < 0.001; F1,24 (running exercise×treatment) = 18.282, p < 0.001). F-K, Depressive behavioral tests were performed in the STZ-induced diabetic mice subjected to sedentary conditions or running exercise. F, The immobility time in the FST (F1,24 (running exercise) = 20.277, p < 0.001; F1,24 (treatment) = 42.65, p < 0.001; F1,24 (running exercise×treatment) = 1.196, p = 0.285). G, The immobility time in the TST (F1,24 (running exercise) = 47.15, p < 0.001; F1,24 (treatment) = 76.039, p < 0.001; F1,24 (running exercise×treatment) = 28.555, p < 0.001). H, The latency to feed in the NSFT (F1,24 (running exercise) = 13.423, p = 0.001; F1,24 (treatment) = 39.99, p < 0.001; F1,24 (running exercise×treatment) = 9.068, p = 0.006). I, Total distance in the OFT (F1,24 (running exercise) = 55.501, p < 0.001; F1,24 (treatment) = 77.358, p < 0.001; F1,24 (running exercise×treatment) = 1.188, p = 0.287). J, Central distance in the OFT (F1,24 (running exercise) = 129.104, p < 0.001; F1,24 (treatment) = 150.511, p < 0.001; F1,24 (running exercise×treatment) = 1.244, p < 0.276). K, Number of crossing squares in the OFT (F1,24 (running exercise) = 31.274, p < 0.001; F1,24 (treatment) = 64.746, p < 0.001; F1,24 (running exercise×treatment) = 0.027, p < 0.872). Data were presented as means ± SEM (n = 7, two-way ANOVA). ** p < 0.01.

Similar articles

References

    1. ElSayed NA, Aleppo G, Aroda VR, Bannuru RR, Brown FM, Bruemmer D. et al. 2. Classification and Diagnosis of Diabetes: Standards of Care in Diabetes-2023. Diabetes care. 2023;46:s19–s40. - PMC - PubMed
    1. Cooper ZW, O'Shields J, Ali MK, Chwastiak L, Johnson LCM. Effects of Integrated Care Approaches to Address Co-occurring Depression and Diabetes: A Systematic Review and Meta-analysis. Diabetes Care. 2024;47:2291–2304. - PubMed
    1. Su W-J, Li J-M, Zhang T, Cao Z-Y, Hu T, Zhong S-Y. et al. Microglial NLRP3 inflammasome activation mediates diabetes-induced depression-like behavior via triggering neuroinflammation. Prog Neuropsychopharmacol Biol Psychiatry. 2023;126:110796. - PubMed
    1. Yang F, Wang X, Qi J, Zhang K, Jiang Y, Feng B. et al. Glucagon-like Peptide 1 Receptor Activation Inhibits Microglial Pyroptosis via Promoting Mitophagy to Alleviate Depression-like Behaviors in Diabetic Mice. Nutrients. 2023;15:38. - PMC - PubMed
    1. Li Q, Xie Y, Lin J, Li M, Gu Z, Xin T. et al. Microglia Sing the Prelude of Neuroinflammation-Associated Depression. Mol Neurobiol. 2025;62(4):5311–5332. doi: 10.1007/s12035-024-04575-w. - PubMed

MeSH terms

LinkOut - more resources