. 2025 May 25;15(13):6329-6346.
doi: 10.7150/thno.110305. eCollection 2025.

Boosting mRNA cancer vaccine efficacy via targeting Irg1 on macrophages in lymph nodes

Affiliations

Boosting mRNA cancer vaccine efficacy via targeting Irg1 on macrophages in lymph nodes

Wenwen Wei et al. Theranostics. .

Abstract

Rationale: mRNA cancer vaccines show great promise for tumor therapy, but the therapeutic efficacy is limited. Metabolites play critical roles in immunomodulation. However, their role in mRNA cancer vaccines remains poorly understood. Methods: Metabolome analysis and single-cell RNA sequence were performed to explore the most important metabolite and its source cell. B16-F10-OVA-bearing wide-type and Irg1-depleted C57BL/6 mice were treated with OVA-LNP, OVA&si-Irg1-LNP, or anti-PD-1 antibody to evaluate therapeutic efficacy. Flow cytometry analysis was used to examine the immune cells within the lymph nodes, spleens, and the tumor immune environment. Results: We found that macrophage-derived itaconate was increased markedly in activated ipsilateral lymph nodes after ovalbumin-encoding mRNA-lipid nanoparticle (OVA-LNP) injection, compared to homeostatic contralateral lymph nodes. Depleting the immune-responsive gene 1(Irg1), which encodes the itaconate-production enzyme aconitate decarboxylase (ACOD1), in macrophages improved dendritic cell antigen presentation and enhances T cell function. Combining Irg1 knockdown via small interfering RNA (siRNA) with OVA mRNA in LNPs augmented the therapeutic efficacy of mRNA cancer vaccines, both as monotherapy and in combination with an anti-programmed cell death-1 antibody. Conclusions: Our findings reveal a link between itaconate and mRNA cancer vaccines, suggesting that targeting Irg1 via siRNA-LNP could be a promising strategy to improve the therapeutic efficacy of mRNA cancer vaccines.

Keywords: DCs; anti-PD-1 antibody; mRNA cancer vaccines; macrophages; taconate.


Conflict of interest statement

Competing Interests: The authors have declared that no competing interest exists.

Figures
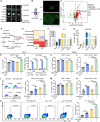
Figure 1
Figure 1
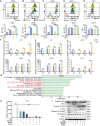
OVA-LNP-induced itaconate suppressed T cell response. (A) The luminescence image of organs in mice after Luciferase-LNP injection for 24h. (B-E) Mice were injected with 5 μg OVA-LNP subcutaneously, and iLNs and cLNs were obtained for metabolome analysis and immunofluorescence at 24 h, n = 5. (B) Immunofluorescence of T cells (CD3), B cells (CD19), DCs (CD11c), and Macrophages (F4/80). scale bars, 100 μm. (C) Volcano plot of different metabolites between iLNs and cLNs. (D) The schematic of the TCA cycle. (E) The heatmap of metabolites of the TCA cycle in iLNs compared to cLNs. (F) Irg1 mRNA expression of organs in mice after OVA-LNP injection for 24h, n = 3. (G) Itaconate concentration of organs in mice after OVA-LNP injection for 24h, n = 3. (H-O) T-cell and B-cell responses to OVA-LNP in WT and Irg1-/- mice at days 14 and 21. (H) The proportion of CD8+ T cells in blood, n = 6. (I) The concentration of OVA sIgE in blood serum was detected by ELISA, n = 3. (J) The percentage of IFNγ+ CD8+ T cells in blood was detected by flow cytometry, n = 6. (K-N) The proportion of CD4+(K), IFNγ+ CD4+(L), CD8+(M), IFNγ+ CD8+ (N)T cells in CD3+ T cells isolated from spleens h, n = 6. (O) Cytotoxicity of CD3+ T cells isolated from spleens after being incubated with B16-F10-OVA tumor cells, n = 6. ns = no significance, * p < 0.05, ** p < 0.01, *** p < 0.001.
Figure 2
Figure 2
OVA-LNP-induced itaconate derived from macrophages in LNs. (A-D) The single-cell sequence of cLNs and iLNs was collected at 24 h after the OVA-LNP injection, n = 5. (A) The UMAP visually represented different immune cell types in cLN and iLN. (B) Irg1 expression levels of different immune cells in LNs. (C) The UMAP plot depicted the expression levels of Irg1 in cLNs and iLNs. (D) Comparing the Irg1 expression levels of macrophages in cLNs and iLNs. (E) The different types of immune cells in iLNs, such as NK cells (NK1.1), B cells (CD19), T cells (CD3), Macrophages (F4/80), and DCs (CD11c), were detected using flow cytometry at 24 h after subcutaneous injection of eGFP-LNP. (F-K) The therapeutic effect and the TME remodeling of OVA-LNP in Irg1f/f Lyz2 cre- (n = 4) and Irg1f/f Lyz2 cre+ (n = 4) mice. (F) Tumor growth curve of ctrl and two-dose 5 μg OVA-LNP treatment on days 7 and 12 in Irg1f/f Lyz2 cre- and Irg1f/f Lyz2 cre+ mice. (G) Tumor image on day 21. (H to K) The percentage of CD45+ immune cells (H), DCs (I), macrophages (J), and IFNγ+ CD8+ T cells (K) within the TME between four groups. (L) Irg1 mRNA expression of organs in mice with Clo at day 1 and OVA-LNP at day 2 for 24h, n = 3. (M-N) The concentration of itaconate in the blood (M) and organs (N) in mice with Clo at day 1 and OVA-LNP at day 2 for 24h, n = 3. ns = no significance, * p < 0.05, ** p < 0.01, *** p < 0.001.
Figure 3
Figure 3
Irg1-induced by OVA-LNP suppressed the pro-inflammatory of macrophages. (A-E) The activation makers of WT and Irg1-/- macrophages were detected by flow cytometry at 24 h after being stimulated by 0.3 μg/mL ctrl-LNP or OVA-LNP. CD80 (A), CD86 (B), MHC I (C), MHC II (D), and CCR7 (E) levels of macrophages, n = 3. (F) The Il1β, Il6, Il23α, Cxcl9, Cxcl10, and Ccr7 expression levels of WT and Irg1-/- macrophages, which were stimulated by 0.3 μg/mL ctrl-LNP or OVA-LNP at 2, 4, 8, 12 h, were measured by qRT-PCR, n = 3. (G) Kyoto Encyclopedia of Genes and Genomes (KEGG) enrichment of macrophages in iLNs compared to cLNs. (H) qRT-PCR measured expression levels of Irg1 in BMDMs after treatment with 0.3 μg/mL OVA-LNP and 10 μM MYD88 inhibitor (MYD88i), 10 μM NOD1 inhibitor (NOD1i), and 500 nM RIG1 inhibitor (RIG1i) for 12 h, n = 3. (I) BMDMs were treated with 0.3 μg/mL OVA-LNP and 10 μM MYD88 inhibitor (MYD88i), 10 μM NOD1 inhibitor (NOD1i), and 500 nM RIG1 inhibitor (RIG1i) for 24 h, and cells were collected for western blot analysis. ns = no significance, * p < 0.05, ** p < 0.01, *** p < 0.001.
Figure 4
Figure 4
OVA-LNP-induced itaconate suppressed the function of DCs. (A-B) OVA (A) and Irg1 (B) expression of BMDMs and BMDCs with 0.3 μg/mL OVA-LNP stimulation for 12 h, n = 3. (C) LC/MS measured the concentration of itaconate in the supernatant of BMDM and BMDC after 24 h of OVA-LNP stimulation, n = 3. (D) The concentration of itaconate in the WT and Irg1-/- BMDM supernatant. (E-G) CD80 (E), CD86 (F), and MHC II (G) of BMDCs cultured with BMDMs CM for 24 h were measured by flow cytometry, n = 3. (H) The Il1β, Il8, Cxcl9, Cxcl10, and Ccr7 expression levels of BMDC cultured with BMDM CM for 12 h were measured by qRT-PCR, n = 3. (I-K) The anti-tumor activity and TME remodeling by 4-OI-treated DCs in C57BL/6 mice, n = 5. The tumor growth curve (I), tumor image (J), and tumor weight (K) of B16-F10-OVA-beared mice after administration with DCs or 4-OI-treated DCs subcutaneously at day 5. (L) The proportion of immune cells and CD3+, CD4+, and CD8+ T cells within TME after treatment with DCs or 4-OI-treated DCs compared to the control group. (M) The percentage of IFNγ+ CD4+ T cells among CD4+T cells in the TME. (N) The statistics and presentative data of IFNγ+ CD8+ T cells in the TME. ns = no significance, * p < 0.05, ** p < 0.01, *** p < 0.001.
Figure 5
Figure 5
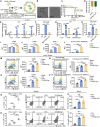
Targeting Irg1 on macrophages in LNs. (A) The diagram of the process of encapsulating OVA&si-Irg1-LNP. (B) The structure of OVA&si-Irg1-LNP by cryo-TEM. (C-D) The diameter (C) and zeta potential (D) of OVA-LNP and OVA&si-Irg1-LNP. (E) Irg1 expression levels of BMDM after treatment with 0.3 μg/mL OVA-LNP and OVA&si-Irg1-LNP for different time points detected by qRT-PCR, n = 3. (F) The itaconate concentration of supernatant of BMDM after treatment with 0.3 μg/mL OVA-LNP and OVA&si-Irg1-LNP for 24 h was detected by LC/MS, n = 3. (G) Irg1 expression levels of LNs after treatment with 5 μg OVA-LNP and OVA&si-Irg1-LNP subcutaneously for 24 and 48 h were detected by qRT-PCR, n = 5. (H) The itaconate concentration of intertissue fluid of LNs after treatment with 5 μg OVA-LNP and OVA&si-Irg1-LNP for 24 h was detected by LC/MS. (I-L) CD80 (I), CD86 (J), MHC I (K), and H-2b bound to SIINFEKL (L) of BMDM after treatment with 0.3 μg/mL OVA-LNP and OVA&si-Irg1-LNP for 24 h were detected by flow cytometry, n = 3. (M-P) The CD86 and H-2b bound to SIINFEKL of macrophages (M and N) and DC (O-P) in LNs after treatment with 5 μg OVA-LNP and OVA&si-Irg1-LNP subcutaneously in C57BL/6 mice for 24 h were detected by flow cytometry, n = 5. (Q-R) The statistic and presentative data of IFNγ+ Gzmb+ CD4+(Q), IFNγ+ Gzmb+ CD8+ (R) T cells in spleens were detected by flow cytometry after treatment with 5 μg OVA-LNP and OVA&si-Irg1-LNP subcutaneously in C57BL/6 mice for 21 days, n = 5. (S-T) The concentration of OVA sIgE in blood serum at days 14 (S) and 21 (T) was detected by ELISA with 5 μg OVA-LNP and OVA&si-Irg1-LNP injection subcutaneously, n = 5. ns = no significance, * p < 0.05, ** p < 0.01, *** p < 0.001.
Figure 6
Figure 6
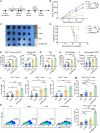
OVA&si-Irg1-LNP promoted therapeutic efficacy and remodeled the tumor microenvironment in the B16-F10 melanoma mouse model. (A)The schematic diagram of the B16-F10-OVA-beared melanoma mouse model, n = 5. (B-C) The tumor growth curve (B) and tumor image (C) of the B16-F10-beared mice after administration with two-dose LNPs. (D) Kaplan-Meier analysis of B16-F10-OVA melanoma mice. (E-N) The percentage of immune cells in the TME was detected by flow cytometry after LNP treatment for 21 days. (E-I) The proportion of CD45+ immune cells (E), CD11b+ myeloid cells (F), CD11c+ DCs (G), F4/80+ macrophages (H), CD86 expression level of macrophages (I) within TME. (J-N) Flow cytometry analysis of CD3+ (J), CD4+ (K), CD8+ (L), IFNγ+ CD4+ (M) T cells, and the presentative and statistic proportion of IFNγ+ CD8+ T cells (N) in the TME after LNPs treatment. ns = no significance, * p < 0.05, ** p < 0.01, *** p < 0.001.
Figure 7
Figure 7
OVA&si-Irg1-LNP enhanced the anti-tumor efficacy of anti-PD-1 antibody. (A) The schematic diagram showed the administration of LNPs alone or combined with an anti-PD-1 antibody in a B16-F10-OVA-bearing melanoma mouse model, n = 5. (B-D) The tumor growth (B), tumor image (C), and tumor volume at day 19 (D) of the B16-F10-OVA-beared mice. (E) The immune cells, like DCs (CD11b), macrophage (F4/80), and CD8+ T cells (CD8), were detected by immunofluorescence in the TME. ns = no significance, * p < 0.05, ** p < 0.01, *** p < 0.001.

References

    1. Conry RM, LoBuglio AF, Wright M, Sumerel L, Pike MJ, Johanning F. et al. Characterization of a messenger RNA polynucleotide vaccine. Cancer Res. 1995;55:1397–400. - PubMed
    1. Sahin U, Karikó K, Türeci Ö. mRNA-based therapeutics-developing a new class of drugs. Nat Rev Drug Discov. 2014;13:759–80. - PubMed
    1. Polack FP, Thomas SJ, Kitchin N, Absalon J, Gurtman A, Lockhart S. et al. Safety and efficacy of the BNT162b2 mRNA Covid-19 vaccine. N Engl J Med. 2020;383:2603–15. - PMC - PubMed
    1. Qu P, Faraone JN, Evans JP, Zheng YM, Yu L, Ma Q. et al. Durability of booster mRNA vaccine against SARS-CoV-2 BA.2.12.1, BA.4, and BA.5 subvariants. N Engl J Med. 2022;387:1329–31. - PMC - PubMed
    1. Karikó K, Buckstein M, Ni H, Weissman D. Suppression of RNA recognition by Toll-like receptors: the impact of nucleoside modification and the evolutionary origin of RNA. Immunity. 2005;23:165–75. - PubMed

MeSH terms

LinkOut - more resources