. 2025 May 25;15(13):6516-6533.
doi: 10.7150/thno.114912. eCollection 2025.

Loss of SLC25A20 in Pancreatic Adenocarcinoma Reversed the Tumor-Promoting Effects of a High-Fat Diet

Affiliations

Loss of SLC25A20 in Pancreatic Adenocarcinoma Reversed the Tumor-Promoting Effects of a High-Fat Diet

Sang Myung Woo et al. Theranostics. .

Abstract

Rationale: Although it is known that High-fat diet (HFD) promotes the development of pancreatic ductal adenocarcinoma (PDAC), no direct link between HFD and cancer has been identified. Previously, we showed that ATP production by cancer cells depends on fatty acid oxidation (FAO); therefore, we hypothesized that blocking FAO may prevent HFD-induced promotion of PDAC growth. Methods: To determine whether FAO is increased in PDAC patients, we analyzed a tissue microarray by immunohistochemical staining to detect carnitine palmitoyl transferase I. To block FAO, SLC25A20 (carnitine-acylcarnitine carrier) was knocked down in cancer cells, which was implanted for xenograft in mice and treated with a high-fat diet (HFD, 60% fat). To compare cancer development including survival rates, and histopathological differences were analyzed by crossbreeding of KPC mice (KrasG12D/+; Trp53R172H/+; Pdx1-Cre) with KPC/Slc25a20+/- mice. Results: SLC25A20 knockdown in cancer cells reduced ATP production and inhibited cell growth. Proteome analysis revealed that SLC25A20 knockdown reduced cancer cell growth significantly due to inactivation of mTOR via decreased ATP production, ultimately leading to cell death. The median survival time of KPC/Slc25a20+/- tumor-bearing mice was 3.1 weeks longer than that of KPC tumor-bearing mice. In mice fed an HFD, the growth of xenografts derived from SLC25A20 knockdown PDAC cells was 65-95% lower than that of xenografts derived from control cells. Conclusion: Blocking FAO by SLC25A20 knockdown reversed HFD-induced promotion of PDAC growth.

Keywords: Fatty acid oxidation; High-fat diet; PDAC; Pancreatic cancer; SLC25A20.


Conflict of interest statement

Competing Interests: The authors, except SK, declare no conflicts of interest. SK has filed a patent to develop an anti-cancer drug targeting SLC25A20 and founded an in-house venture company at the National Cancer Center in the Republic of Korea.

Figures
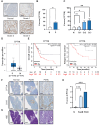
Figure 1
Figure 1
Expression of the FAO marker CPT1A increases as the grade of PDAC increases. (A) Immunohistochemical (IHC) staining of CPT1A using tissue microarrays derived from normal (n = 27) controls and patients with grade 1 (n = 18), grade 2 (n = 74), or grade 3 (n = 45) PDAC. Representative images were selected from the TMA (Figure S1A). Scale bar = 100 µm. (B) H-scores for normal (N, n = 27) and tumor tissues (P, n = 137), were calculated using Inform software. The median H-score for CPT1A in normal and pancreatic cancer tissues was 11.30 and 35.50, respectively. (C) H-Scores for normal (N, n = 27), grade 1 (Gr1, n = 18), grade 2 (Gr2, n = 74), and grade 3 (Gr3, n = 45) pancreatic tissue. The median H-score for CPT1A in grade 1, 2, and 3 PDAC tissues was 11.78, 35.64, and 42.71, respectively. (D) CPT1A mRNA levels in PDAC patients (P, n = 179) were compared with those in matched normal (N, n = 171) controls using the GEPIA website (http://gepia.cancer-pku.cn/). (E) Pancreatic adenocarcinoma datasets related to CPT1A expression were analyzed using the Kaplan-Meier Plotter (https://kmplot.com/analysis/). PDAC patients were shown with high expression of CPT1A (red line) and with low expression of CPT1A (black line). (F, G). Representative IHC images of CPT1A and CK-19 expression (F), and H&E (G) staining of the pancreas from normal, low-grade PanIN, high-grade PanIN, and PDAC KPC mice (KrasG12D; Trp53R172H; Pdx1-Cre). (H). H-score scores for normal (n = 8), PanIN (n = 27), and PDAC (n = 5) tissues. Scale bar = 150 µm. The median of CPT1A H-scores in normal, PanIN, and PDAC tissues were 0.125, 2.111, and 3, respectively. *p < 0.05, **p < 0.01, ***p < 0.001.
Figure 2
Figure 2
Cancer cells rely on fatty acids to produce ATP and promote growth. (A) To test whether growth of pancreatic cancer cells was evaluated in a clonogenic assay after culture for 2 weeks in the presence of charcoal-stripped serum (CSS), or normal serum (NS, 10%), or NS medium supplemented with fatty acids (NS + FA 0.25 ml/L) (n=5). (B-E) The increase in ATP production following FA dose-dependent treatment was measured using a seahorse XFe96 analyzer. (B) In hTERT-HPNE normal cells, additional treatment with FA did not cause changes in ATP synthesis. ATP levels were FA dose-dependently increased in MIA PaCa-2 (C), SU.86.86 (D), and PANC-1 (E). (F) To test whether the reduced growth of pancreatic cancer cells by CSS treatment (A) can be rescued by fatty acid treatment (CSS + FA 0.25 ml/L) (n=5). Data was shown as the mean ± SD of at least three experiments. *p < 0.05, **p < 0.01, ***p < 0.001.
Figure 3
Figure 3
SLC25A20 knockdown reduces ATP production in PDAC cells. (A) Summary of fatty acid transportation into mitochondria for FAO. CPTI/II (carnitine palmitoyl transferase I/II), CAT (carnitine acetyltransferase), ETC-OxPhos (electron transfer complex-oxidative phosphorylation). (B) Immunoblot analysis was shown in Figure S4A. ATP levels in PDAC cell lines MIA PaCa-2 and SU.86.86 were then measured by Seahorse XFe96 analysis. All data were normalized by SRB analysis. (C) Immunoblot analysis was shown in Figure S4B. ATP levels in hTERT-HPNE cell line were measured with Seahorse XFe96. All data were normalized by measuring SRB assay. (D, E) The metabolomes of various acyl-carnitines (D) and fatty acids (E) in MIA PaCa-2 cells without (control) and with SLC25A20 knockdown (orange) were analyzed by MS/MS. The y-axis shows the results of the SLC25A20 knockdown, expressed as a relative ratio with the control set to 1.0. (F and G) The metabolomes of various acyl-carnitines (F) and fatty acids (G) in SU.86.86 cells without (control) and with SLC25A20 knockdown (blue) were analyzed by MS/MS. The y-axis shows the results of the SLC25A20 knockdown, expressed as a relative fold ratio, with the control set to 1.0. Data are expressed as the mean ± SD of three independent experiments. *p < 0.05, **p < 0.01, ***p < 0.001.
Figure 4
Figure 4
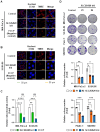
SLC25A20 knockdown reduces mitochondrial activity and colony formation by PDAC cells. (A and B) The mitochondrial membrane potential of MIA PaCa-2 (A) and SU.86.86 (B) without (control) and with SLC25A20 knockdown was measured by fluorescence microscopy after TMRE staining (Red). Scale bars: green = 50 μm; yellow = 25 μm. (C) Mitochondrial membrane potential was assessed by measuring the intensity of TMRE fluorescence using ZEN software 3.9. The bars in the graph show TMRE intensity normalized by the number of DAPI positive per unit area. (D) Cancer cell growth was measured in a colony formation assay. MIA PaCa-2, SU.86.86, Panc-1 and SW1990 cells with SLC25A20 knockdown induced by two different shRNAs (#1 and #2) were seeded in a six-well plate and cultured for 14 days. Colonies were stained with crystal violet and counted using ImageJ software. The y-axis shows the number of SLC25A20 knockdown colonies expressed as a relative ratio, with the number of control colonies set to 1.0. Data are presented as the mean ± SD from at least three experiments. *p < 0.05, **p < 0.01, ***p < 0.001.
Figure 5
Figure 5
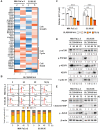
SLC25A20 knockdown induces cell cycle arrest and cell death by turning off mTOR signaling via a reduction in ATP levels. (A) MIA PaCa-2 and SU.86.86 were treated with 40 nM of SLC25A20 siRNA for 48 h. LC-MS/MS was used to analyze changes in intracellular phosphor-protein levels. (B) Flow cytometry was used to examine the cell cycle distribution of MIA PaCa-2 and SU.86.86 cells with SLC25A20 knockdown. Cells were synchronized to the same cycle by treatment with thymidine (2 mM) for 24 h, and then treated with siRNA at the indicated times. The cell cycle distribution was measured by staining cells with PI. (C) Changes in ATP production by MIA PaCa-2 and SU.86.86 cells were analyzed following SLC25A20 knockdown. Immunoblotting was performed at different times (0-72 h post-knockdown) to analyze changes in cell growth (D) and cell death induction (E) in MIA PaCa-2 and SU.86.86 cells. The cell cycle distribution was associated with changes in cyclin D1 levels (D). DNA damage was determined by measuring changes in PARP and cleaved PARP levels. Cell death was determined by measuring changes in g-H2AX levels (E). Data are presented as the mean ± SD of at least three experiments. *p < 0.05, **p < 0.01, ***p < 0.001.
Figure 6
Figure 6
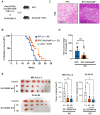
Crossing Slc25a20 knock-out mice with KPC mice generates offspring showing slower progression of pancreatic cancer. (A) Crossing of KPC and Slc25a20 knock-out mice generated KPC/Slc25a20+/- mice harboring four mutated genes: KrasG12D, Trp53R172H, Pdx1-cre, and Slc25a20+/-. (B) Kaplan-Meier survival curves for KPC/Slc25a20+/- mice (n = 23) and KPC mice (n = 29). The difference between the two groups was significant (p = 0.004). (C) In KPC/Slc25a20+/- mice group, most mice showed sporadic changes to noninvasive, dysplastic PanIN of pancreas parenchyma (right), whereas KPC mice have invasive PDACs (left). Images of representative samples corresponding to the median values in each group (original magnification: x200, scale bar: 200μm) (D) Decreased PanIN and PDAC progression by the haplo-sufficiency of Slc25a20 in the KPC mice model. (E) Mouse xenograft models were tested using MIA PaCa-2 (1 x 10⁷ cells/mouse, n=7) and SU.86.86 (5 x 10⁶ cells/mouse, n =5) cells without (control) and with SLC25A20 knockdown by two sets of shRNA #1 and #2. After 4-5 weeks of tumor growth, tumors were removed and measured in volume. The data was presented as the mean ± SD from at least three experiments. *p < 0.05, **p < 0.01, ***p < 0.001.
Figure 7
Figure 7
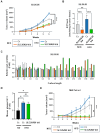
SLC25A20 knockdown slows the growth of HFD-induced pancreatic cancer. (A) The effect of SLC25A20 knockdown in the SU.86.86 xenograft model (5 × 10⁶ cells/mouse; n=10) mice fed a caloric-balanced HFD (60% fat) or NFD (0% fat). Growth of SLC25A20 knockdown (orange) cells was compared with that of control (gray) cells under NFD conditions. Growth of SLC25A20 knockdown (green) cells was compared with the control (blue) under HFD conditions. (B) Intra-tumor ATP levels in SU.86.86 SLC25A20 knockdown tumor and control tissues. (C) Blood acyl-carnitine concentrations were analyzed in the control and SLC25A20 knockdown SU.86.86 groups. (D) The amount of IGF-1 in plasma was measured to investigate the pathways driving tumor growth. (E) The effect of SLC25A20 knockdown in the MIA PaCa-2 xenograft model (5 × 10⁶ cells/mouse; n=6) was also tested in mice fed a calorie-balanced HFD or NFD. Growth of SLC25A20 knockdown (orange) cells compared with the control (gray) under NFD conditions, and growth of SLC25A20 knockdown (green) cells compared with the control (blue) under HFD conditions. Statistical analysis was performed using unpaired two-tailed t-tests to compare differences between groups. Data are presented as the mean ± SD from at least three experiments. *p < 0.05, **p < 0.01, ***p < 0.001.
Figure 8
Figure 8
Blocking FAO by SLC25A20 knockdown reversed HFD-induced tumor promotion. (A) Cancer cells absorb fatty acids from HFDs and convert them into LC, MC, and SC acyl-carnitine, which they use to produce acetyl-CoA via FAO in the mitochondria. The acetyl-CoA is converted to NADH in the TCA cycle, which is then used to produce ATP via the electron transport chain (ETC). Previously this FAO dependent ATP production in cancer was proposed as “Kim effect” to avoid confusion with the reprogramming theories . Increased ATP levels activate p-mTOR, which in turn increases the expression of cyclin D1, essential for cell growth, and promotes the expression of PARP, which plays an important role in detecting and repairing DNA damage within cells. These survival programmes promote the growth of cancer cells. (B) FAO inhibition by SLC25A20 knockdown caused a decrease in ATP level, which induced mTOR inactivation, and consequently resulted in cell cycle arrest and cell death activation.

References

    1. Friedenreich CM, Ryder-Burbidge C, McNeil J. Physical activity, obesity and sedentary behavior in cancer etiology: epidemiologic evidence and biologic mechanisms. Mol Oncol. 2021;15:790–800. - PMC - PubMed
    1. An C, Pipia I, Ruiz AS, Arguelles I, An M, Wase S. et al. The molecular link between obesity and genomic instability in cancer development. Cancer Lett. 2023;555:216035. - PubMed
    1. Rawla P, Thandra KC, Sunkara T. Pancreatic cancer and obesity: epidemiology, mechanism, and preventive strategies. Clin J Gastroenterol. 2019;12:285–91. - PubMed
    1. Molina-Montes E, Coscia C, Gomez-Rubio P, Fernandez A, Boenink R, Rava M. et al. Deciphering the complex interplay between pancreatic cancer, diabetes mellitus subtypes and obesity/BMI through causal inference and mediation analyses. Gut. 2021;70:319–29. - PubMed
    1. Lindstrom P. The physiology of obese-hyperglycemic mice [ob/ob mice] ScientificWorldJournal. 2007;7:666–85. - PMC - PubMed

MeSH terms

Substances